As the world attempts to transition its energy systems away from fossil fuels towards low-carbon sources of energy, we have a range of energy options: renewable energy technologies such as hydropower, wind and solar, but also nuclear power. Nuclear energy and renewable technologies typically emit very little CO2 per unit of energy production, and are also much better than fossil fuels in limiting levels of local air pollution.
But whilst some countries are investing heavily in increasing their nuclear energy supply, others are taking their plants offline. The role that nuclear energy plays in the energy system is therefore very specific to the given country.
How much of our energy comes from nuclear power? How is its role changing over time? In this article we look at levels and changes in nuclear energy generation across the world, and its safety record in comparison to other sources of energy.

Nuclear energy – alongside hydropower – is one of our oldest low-carbon energy technologies.
Nuclear power generation has been around since the 1960s, but saw massive growth globally in the 1970s, 80s and 90s. In the interactive chart shown we see how global nuclear generation has changed over the past half-century.
Following fast growth during the 1970s to 1990s, global generation has slowed significantly. In fact, we see a sharp dip in nuclear output following the Fukushima tsunami in Japan in 2011 [we look at the impacts of this disaster later in this article], as countries took plants offline due to safety concerns.
But we also see that in recent years, production has once again increased.


The global trend in nuclear energy generation masks the large differences in what role it plays at the country level.
Some countries get no energy at all from nuclear – or are aiming to eliminate it completely – whilst others get the majority of their power from it.
This interactive chart shows the amount of nuclear energy generated by country. We see that France, the USA, China, Russia and Canada all produce relatively large amounts of nuclear power.
Two tips on how you can interact with this chart
- View the data for any country as a line chart: click on any country to see its change over time, or by using the ‘CHART’ tab at the bottom.
- Add any other country to the line chart: click on the Add country button to compare with any other country.
What share of primary energy comes from nuclear?

We previously looked nuclear output in terms of energy units – how much each country produces in terawatt-hours. But to understand how large of a role nuclear plays in the energy system we need to put this in perspective of total energy consumption.
This interactive chart shows the share of primary energy that comes from nuclear sources.
Note that this data is based on primary energy calculated by the ‘substitution method’ which attempts to correct for the inefficiencies in fossil fuel production. It does this by converting non-fossil fuel sources to their ‘input equivalents’: the amount of primary energy that would be required to produce the same amount of energy if it came from fossil fuels. Here we describe this adjustment in more detail.
In 2019, just over 4% of global primary energy came from nuclear power.
Note that this is based on nuclear energy’s share in the energy mix. Energy consumption represents the sum of electricity, transport and heating. We look at the electricity mix below.
What share of electricity comes from nuclear?

In the sections above we looked at the role of nuclear in the total energy mix. This includes not only electricity, but also transport and heating. Electricity forms only one component of energy consumption.
Since transport and heating tend to be harder to decarbonize – they are more reliant on oil and gas – nuclear and renewables tend to have a higher share in the electricity mix versus the total energy mix.
This interactive chart shows the share of electricity that comes from nuclear sources.
Globally, around 10% of our electricity comes from nuclear. But some countries rely on it heavily: it provides more than 70% of electricity in France, and more than 40% in Sweden.
- What are the safest sources of energy?
- Nuclear and renewables are far, far safer than fossil fuels
- Putting death rates from energy in perspective
- The safest energy sources are also the cleanest
- How many people has nuclear energy saved?
- What was the death toll from Chernobyl and Fukushima?
- How many died from the nuclear accident in Chernobyl?
- How many died from the nuclear accident in Fukushima?
- What can we learn from these nuclear disasters?
- Nuclear is one of the safest energy sources
What are the safest sources of energy?
Energy has been critical to the human progress we’ve seen over the last few centuries. As the United Nations rightly says: “energy is central to nearly every major challenge and opportunity the world faces today.”
But while energy brings us massive benefits, it’s not without its downsides. Energy production can have negative impacts on human health and the environment in three ways.
The first is air pollution: millions of people die prematurely every year as a result of air pollution. Fossil fuels and the burning of biomass – wood, dung, and charcoal – are responsible for most of those deaths.
The second is accidents. This includes accidents that happen in the mining and extraction of the fuels – coal, uranium, rare metals, oil, and gas. And it also includes accidents that occur in the transport of raw materials and infrastructure, the construction of the power plant, or their maintenance.
The third is greenhouse gas emissions: fossil fuels are the main source of greenhouse gases, the primary driver of climate change. In 2020, 91% of global CO2 emissions came from fossil fuels and industry.1
No energy source is completely safe. They all have short-term impacts on human health, either through air pollution or accidents. And they all have long-term impacts by contributing to climate change.
But, their contribution to each differs enormously. Fossil fuels are both the dirtiest and most dangerous in the short term, and emit the most greenhouse gases per unit of energy. This means that there are thankfully no trade-offs here: low-carbon energy sources are also the safest. From the perspective of both human health and climate change, it matters less whether we transition to nuclear power or renewable energy, and more that we stop relying on fossil fuels.
Nuclear and renewables are far, far safer than fossil fuels
Before we consider the long-term impacts of climate change, let’s look at how each source stacks up in terms of short-term health risks.
To make these comparisons fair we can’t just look at the total deaths from each source: fossil fuels still dominate our global electricity mix, so we would expect that they would kill more people.
Instead, we compare them based on the estimated number of deaths they cause per unit of electricity. This is measured in terawatt-hours. One terawatt-hour is about the same as the annual electricity consumption of 150,000 citizens in the European Union.2
This includes deaths from air pollution and accidents in the supply chain.3
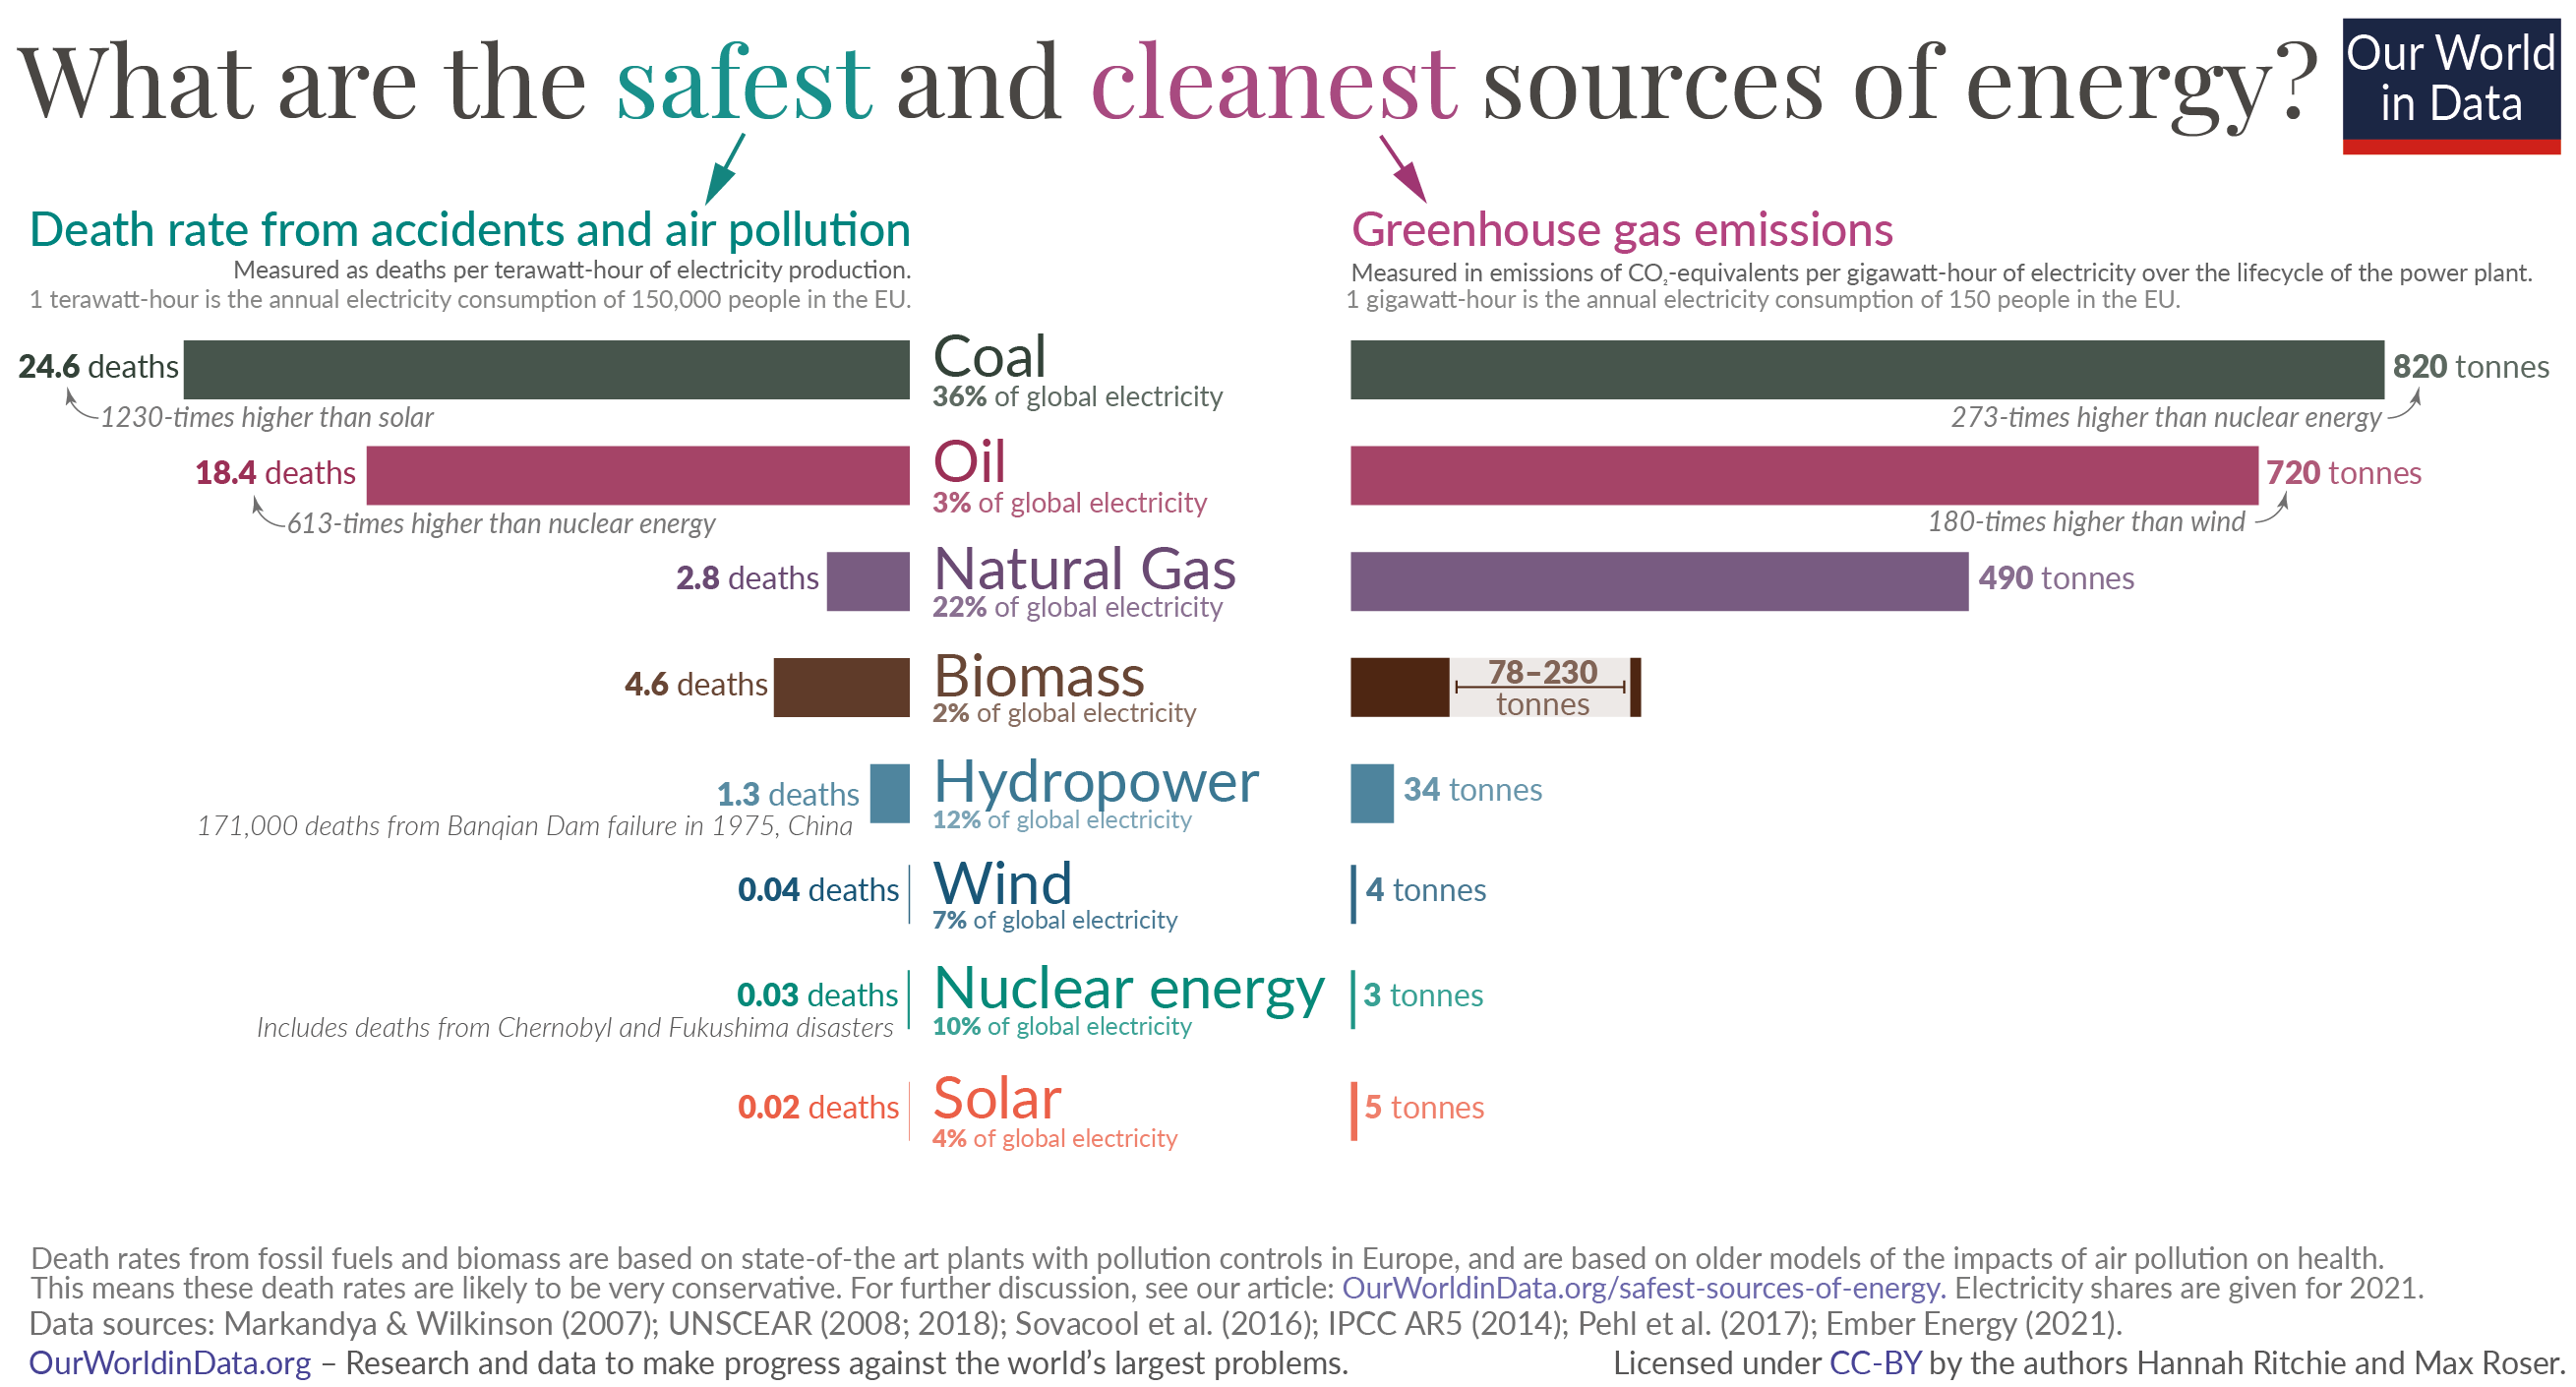
Let’s look at this comparison in the chart. Fossil fuels and biomass kill many more people than nuclear and modern renewables per unit of electricity. Coal is, by far, the dirtiest.
Even then, these estimates for fossil fuels are likely to be very conservative. They are based on power plants in Europe, which have good pollution controls, and are based on older models of the health impacts of air pollution. As I discuss in more detail at the end of this article, global death rates from fossil fuels based on the most recent research on air pollution are likely to be even higher.
Our perceptions of the safety of nuclear energy are strongly influenced by two accidents: Chernobyl in Ukraine in 1986, and Fukushima in Japan in 2011. These were tragic events. However, compared to the millions that die from fossil fuels every year the final death tolls were very low. To calculate the death rates used here I assume a death toll of 433 from Chernobyl, and 2,314 from Fukushima.4 If you are interested in this, I look at how many died in each accident in detail in a related article.
The other source which is heavily influenced by a few large-scale accidents is hydropower. Its death rate since 1965 is 1.3 deaths per TWh. This rate is almost completely dominated by one event: the Banqiao Dam Failure in China in 1975. It killed approximately 171,000 people. Otherwise, hydropower was very safe, with a death rate of just 0.04 deaths per TWh – comparable to nuclear, solar, and wind.
Finally, we have solar and wind. The death rates from both of these sources are low, but not zero. A small number of people die in accidents in supply chains – ranging from helicopter collisions with turbines; fires during the installation of turbines or panels; and drownings on offshore wind sites.
People often focus on the marginal differences at the bottom of the chart – between nuclear, solar, and wind. This comparison is misguided: the uncertainties around these values mean they are likely to overlap.
The key insight is that they are all much, much safer than fossil fuels.
Nuclear energy, for example, results in 99.9% fewer deaths than brown coal; 99.8% fewer than coal; 99.7% fewer than oil; and 97.6% fewer than gas. Wind and solar are just as safe.

Putting death rates from energy in perspective
Looking at deaths per terawatt-hour can seem abstract. Let’s try to put it in perspective.
Let’s consider how many deaths each source would cause for an average town of 150,000 people in the European Union, which – as I’ve said before – consumes one terawatt-hour of electricity per year. Let’s call this town ‘Euroville’.
If Euroville was completely powered by coal we’d expect at least 25 people to die prematurely every year from it. Most of these people would die from air pollution.
This is how a coal-powered Euroville would compare with towns powered entirely by each energy source:
- Coal: 25 people would die prematurely every year;
- Oil: 18 people would die prematurely every year;
- Gas: 3 people would die prematurely every year;
- Hydropower: In an average year 1 person would die;
- Wind: In an average year nobody would die. A death rate of 0.04 deaths per terawatt-hour means every 25 years a single person would die;
- Nuclear: In an average year nobody would die – only every 33 years would someone die.
- Solar: In an average year nobody would die – only every 50 years would someone die.
The safest energy sources are also the cleanest
The good news is that there is no trade-off between the safest sources of energy in the short term, and the least damaging for the climate in the long term. They are one and the same, as the chart below shows.
In the chart, on the left-hand side, we have the same comparison of death rates from accidents and air pollution that we just looked at. On the right, we have the amount of greenhouse gas that are emitted per unit of electricity production.
These are not just the emissions from the burning of fuels, but also from the mining, transportation and maintenance over a power plant’s lifetime.5
Coal, again, is the dirtiest fuel. It emits much more greenhouse gases than other sources – hundreds of times more than nuclear, solar, and wind.
Oil and gas are also much worse than nuclear and renewables, but to a lesser extent than coal.
Unfortunately, the global electricity mix is still dominated by fossil fuels: coal, oil, and gas account for around 60%. If we want to stop climate change we have a great opportunity in front of us: we can transition away from them to nuclear and renewables, and also reduce deaths from accidents and air pollution as a side effect.6
This transition will not only protect future generations, but it will also come with huge health benefits for the current one.
How many people has nuclear energy saved?
When people discuss the safety of nuclear energy they often focus on the number of deaths it has caused. But as we looked at previously, nuclear is one of the safest and cleanest energy sources – per unit of energy it results in hundreds of fewer deaths than coal, oil or gas, and is comparable to modern renewables such as solar or wind.
By this reasoning, we should perhaps turn this question on its head and ask: “How many lives has nuclear energy saved?”, or “How many lives could have been saved if countries had not abandoned it?”
In the wake of the 2011 Fukushima nuclear disaster, Germany announced plans to phase out nuclear power generation: over the period from 2011 to 2017 it shut down 10 of its 17 nuclear facilities, and plans to close the remaining reactors in 2022.7
Because nuclear is safer than its main alternatives this policy decision cost lives.
Replacing nuclear energy with fossil fuels kills people. This is likely to be the case in the recent example of Germany. Most of Germany’s energy deficit from scrapping nuclear was filled by increased coal production – which is, as we just saw, the most polluting source with the largest health impacts. Analysis by Stephen Jarvis, Olivier Deschenes, and Akshaya Jha (2020) estimates that Germany’s nuclear phase-out has come at the cost of more than 1,100 additional deaths each year as a result of air pollution.8 Germany’s plan to make its energy systems safer has done exactly the opposite.
In a study published in the journal Environmental Science and Technology, Pushker Kharecha and James Hansen (2013) aimed to answer the question ‘how many lives has nuclear power saved?’.9 They analysed how many more people would have died over the period from 1971 to 2009 if nuclear energy had been replaced by fossil fuels. The death toll would have depended on the mix of fossil fuels used to replace nuclear – more would have died if more coal was used than oil or gas – but they estimate that nuclear power has globally saved about two million lives.10
What was the death toll from Chernobyl and Fukushima?
Nuclear energy is an important source of low-carbon energy. But, there is strong public opposition to it, often because of concerns around safety.
These concerns are often sparked by memories of two nuclear accidents: the Chernobyl disaster in Ukraine in 1986, and Fukushima in Japan in 2011.11
These two events were by far the largest nuclear accidents in history; the only disasters to receive a level 7 (the maximum classification) on the International Nuclear Event Scale.
How many people died in these nuclear disasters, and what can we learn from them?
How many died from the nuclear accident in Chernobyl?
In April 1986, the core of one of the four reactors at Chernobyl nuclear plant, in Ukraine, melted down and exploded. It was the worst nuclear disaster in human history.
There are several categories of deaths linked to the disaster – for some we have a good idea of how many died, for others we have a range of plausible deaths.
30 people died during or very soon after the incident.
Two plant workers died almost immediately in the explosion from the reactor. Overall, 134 emergency workers, plant operators, and firemen were exposed to levels of radiation high enough to suffer from acute radiation syndrome (ARS). 28 of these 134 workers died in the weeks that followed, which takes the total to 30.12
A point of dispute is whether any more of the 134 workers with ARS died as a result of radiation exposure. In 2008, several decades after the incident, the United Nations Scientific Committee on the Effects of Atomic Radiation (UNSCEAR) published a large synthesis of the latest scientific evidence.13 It reported that a further 19 ARS survivors had died by 2006. But many of these deaths were not related to any condition caused by radiation exposure. Seven were related to diseases not related to cancers including tuberculosis, liver disease, and stroke; six were from heart attacks; one from a trauma incident; and five died from cancers.14 It’s difficult to say how many of these deaths could be attributed to the Chernobyl accident – it’s not implausible it played a role in at least some of them, especially the five cancer deaths.
Most of the population was not exposed to levels of radiation that would put them at risk of negative health impacts. However, the slow response to the disaster meant that some individuals were exposed to the short-lived radionuclide Iodine-131 (131I) through the contamination of milk. Radioactive fallout settled on pasture grass across the region; this contaminated milk supplies and leafy vegetables that were consumed in the days immediately after the incident.
This exposure to 131I has not been linked to increased cancer risk in the adult population, but several studies have shown an increased incidence of thyroid cancer in those who were children and adolescents around this time. Figuring out how many cases of thyroid cancer in this young population were caused by the accident is not straightforward. This is because there was a large increase in screening efforts in the aftermath of the disaster. It’s not uncommon for thyroid cancer cases to go undetected – and have no negative impact on an individual’s life. Increased screening, particularly in child populations, would result in finding many cases of cancer that would normally go undetected.
In 2018, UNSCEAR published its latest findings on thyroid cancers attributed to the Chernobyl disaster. Over the period from 1991 to 2015, there were 19,233 cases of thyroid cancer in patients who were younger than 18 at the time of the disaster across Ukraine, Belarus, and exposed regions of Russia. UNSCEAR concluded that around one-quarter of these cases could be linked to radiation exposure. That would mean 4,808 thyroid cancer cases.15
By 2005, it was reported that 15 of these thyroid cancer cases had been fatal.16 However, it was likely that this figure would increase: at least some of those still living with thyroid cancer will eventually die from it.
It’s therefore not possible to give a definitive number, but we can look at survival rates and outcomes to get an estimate. Thankfully the prognosis for thyroid cancer in children is very good. Many patients that have undergone treatment have seen either a partial or complete remission.17 Large-scale studies report a 20-year survival rate of 92% for thyroid cancer.18. Others show an even better prognosis, with a survival rate of 98% after 40 years.19
If we combine standard survival rates with our number of radiation-induced cancer cases – 4,808 cases – we might estimate that the number of deaths could be in the range of 96 to 385. This comes from the assumption of a survival rate of 92% to 98% (or, to flip it, a mortality rate of 2% to 8%).20 This figure comes with significant uncertainty.
Finally, there has been significant concern about cancer risks to the wider population across Ukraine, Belarus, Russia, and other parts of Europe. This topic remains controversial. Some reports in the early 2000s estimated much higher death tolls ranging from 16,000 to 60,000.21 In its 2005 report, the WHO estimated a potential death toll of 4,000.22 These estimates were based on the assumption that a large number of people were exposed to elevated levels of radioactivity, and that radioactivity increases cancer risk, even at very low levels of exposure (the so-called ‘linear no-threshold model’ of radiation exposure).
More recent studies suggest that these estimates were too high. In 2008, the UNSCEAR concluded that radioactive exposure to the general public was very low, and that it does not expect adverse health impacts in the countries affected by Chernobyl, or the rest of Europe.23 In 2018 it published a follow-up report, which came to the same conclusion.
If the health impacts of radiation were directly and linearly related to the level of exposure, we would expect to find that cancer rates were highest in regions closest to the Chernobyl site, and would decline with distance from the plant. But studies do not find this. Cancer rates in Ukraine, for example, were not higher in locations closer to the site24 This suggests that there is a lower limit to the level at which radiation exposure has negative health impacts. And that most people were not exposed to doses higher than this.
To summarize the previous paragraphs:
- 2 workers died in the blast.
- 28 workers and firemen died in the weeks that followed from acute radiation syndrome (ARS).
- 19 ARS survivors had died later, by 2006; most from causes not related to radiation, but it’s not possible to rule all of them out (especially five that were cancer-related).
- 15 people died from thyroid cancer due to milk contamination. These deaths were among children who were exposed to 131I from milk and food in the days after the disaster. This could increase to between 96 and 384 deaths, however, this figure is highly uncertain.
- There is currently no evidence of adverse health impacts in the general population across affected countries, or wider Europe.
Combined, the confirmed death toll from Chernobyl is less than 100. We still do not know the true death toll of the disaster. My best approximation is that the true death toll is in the range of 300 to 500 based on the available evidence.25
How many died from the nuclear accident in Fukushima?
In March 2011, there was an accident at the Fukushima Daiichi Nuclear Power Plant in Ōkuma, Fukushima, Japan. This accident was caused by the 2011 Tōhoku earthquake and tsunami – the most powerful earthquake recorded in Japan’s history.
Despite it being such a large event, so far, only one death has been attributed to the disaster. This includes both the direct impact of the accident itself and the radiation exposure that followed. However, it’s estimated that several thousand died indirectly from the stress and disruption of evacuation.
No one died directly from the disaster. However, 40 to 50 people were injured as a result of physical injury from the blast, or radiation burns.
In 2018, the Japanese government reported that one worker has since died from lung cancer as a result of radiation exposure from the event.
Over the last decade, many studies have assessed whether there has been any increased cancer risk for local populations. There appears to be no increased risk of cancer or other radiation-related health impacts.
In 2016, the World Health Organization noted that there was a very low risk of increased cancer deaths in Japan.26
A more difficult question is how many people died indirectly through the response and evacuation of locals from the area around Fukushima. Within a few weeks of the accident more than 160,000 people had moved away, either from official evacuation efforts or voluntarily from fear of further radioactive releases. Many were forced to stay in overcrowded gyms, schools, and public facilities for several months until more permanent emergency housing became available.
The year after the 2011 disaster, the Japanese government estimated that 573 people had died indirectly as a result of the physical and mental stress of evacuation.27 Since then, more rigorous assessments of increased mortality have been done, and this figure was revised to 2,313 deaths in September 2020.
These indirect deaths were attributed to the overall physical and mental stress of evacuation; being moved out of care settings; and disruption to healthcare facilities.
It’s important to bear in mind that the region was also trying to deal with the aftermath of an earthquake and tsunami: this makes it difficult to completely separate the indirect deaths related to the nuclear disaster disruptions, and those of the tsunami itself.
Combined, the confirmed death toll from Fukushima is therefore 2,314.
What can we learn from these nuclear disasters?
The context and response to these disasters were very different, and this is reflected in what people died from in the aftermath.
Many more people died from Chernobyl than from Fukushima. There are several reasons for this.
The first was reactor design. The nuclear reactors at Chernobyl were poorly designed to deal with this meltdown scenario. Its fatal RBMK reactor had no containment structure, allowing radioactive material to spill into the atmosphere. Fukushima’s reactors did have steel-and-concrete containment structures, although it’s likely that at least one of these was also breached.
Crucially, the cooling systems of both plants worked very differently; at Chernobyl, the loss of cooling water as steam actually served to accelerate reactivity levels in the reactor core, creating a positive feedback loop toward the fatal explosion. The opposite is true of Fukushima, where the reactivity reduced as temperatures rose, effectively operating as a self-shutdown measure.
The second factor was government response. In the case of Fukushima, the Japanese government responded quickly to the crisis with evacuation efforts extending rapidly from a 3-kilometer (km), to a 10-km, to a 20-km radius whilst the incident at the site continued to unfold. In contrast, the response in the former Soviet Union was one of denial and secrecy.
It’s reported that in the days which followed the Chernobyl disaster, residents in surrounding areas were uninformed of the radioactive material in the air around them. In fact, it took at least three days for the Soviet Union to admit an accident had taken place, and did so after radioactive sensors at a Swedish plant were triggered by dispersing radionuclides. As we saw above, it’s estimated that approximately 4,808 thyroid cancer cases in children and adolescents could be linked to radiation exposure from contaminated milk and foods. This could have been prevented by an earlier response.
Finally, while an early response from the Japanese government may have prevented a significant number of deaths, many have questioned whether the scale of the evacuation effort – where more than 160,000 people were displaced – was necessary.28 As we see from the figures above, evacuation stress and disruption are estimated to have contributed to several thousand early deaths. Only one death has been linked to the impact of radiation. We don’t know what the possible death toll would have been without any evacuation. That’s why a no-evacuation strategy, if a future accident was to occur, seems unlikely. However, many have called for governments to develop early assessments and protocols of radiation risks, the scale of evacuation needed, and infrastructure to make sure that the disruption to those that are displaced is kept to a minimum.29
Nuclear is one of the safest energy sources
No energy source comes with zero negative impact. We often think of nuclear energy as being more dangerous than other sources because these low-frequency but highly-visible events come to mind.
However, when we compare the death rates from nuclear energy to other sources, we see that it’s one of the safest. The numbers that have died from nuclear accidents are very small in comparison to the millions that die from air pollution from fossil fuels every year. As the linked post shows, the death rate from nuclear is roughly comparable with most renewable energy technologies.
Since nuclear is also a key source of low-carbon energy, it can play a key role in a sustainable energy mix alongside renewables.