Understanding the breakdown of our energy systems – how much energy we get from coal, oil or gas, how much from nuclear, solar or wind – is crucial. It allows us to compare energy mixes across the world; track whether we are making progress on decarbonizing our energy systems; and plan and manage demands for natural resources.
But what seems like a simple exercise – adding up the produced energy from all the different sources – is in fact not straightforward at all. These difficulties result in different approaches for ‘energy accounting’ and present a different picture of the energy mix.
Below, we take a look at the two key methodologies applied to primary energy accounting: ‘direct’ primary energy and primary energy via the ‘substitution method’. These methods are discussed (or debated) often, but I couldn’t find particularly clear or simple explanations of how they differ and what this means for understanding our energy mix. The aim here is to fill that gap.
What’s important is to understand why there are two different methods and how they affect our perspective on the energy mix.
‘Primary energy’ refers to energy in its raw form, before it has been converted by humans into other forms of energy like electricity, heat or transport fuels. Think of this as inputs into an energy system: coal, oil or gas before we burn them; or solar or wind energy before we convert them to electricity.
When we are asking how much energy is consumed or what the breakdown of the sources of energy is we are asking about primary energy.
Here we look at two ways in which ‘primary energy’ is calculated: the ‘direct’ and the ‘substituted’ method. The simplest way to think of the difference between these methods is that ‘direct’ primary energy does not take account of the energy lost in the conversion of fossil fuels to usable energy. The substitution method does attempt to correct for this loss.
To understand why this distinction is important we need to first consider the process of energy production.
When we burn fuel in a thermal power plant most of the energy we put into the process is lost – primarily in the form of heat. Most fossil fuel plants run with an efficiency of around 33% to 40%.1 The remaining 60% to 67% of energy is wasted as heat. This means for every unit of energy that we can use, another two are wasted.
When we measure electricity generation from renewables or nuclear power, we’re measuring the direct output, with no losses or waste to consider.
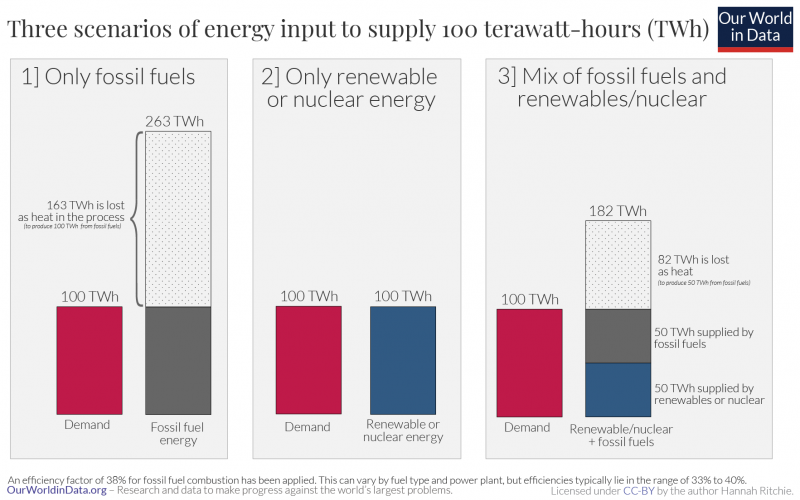
Let’s take an example – shown in the graphic here. Imagine we have a country that needs 100 terawatt-hours (TWh) of energy. We have three different energy mixes: only fossil fuels; only renewable or nuclear energy; and a mix of both.
- If we only rely on fossil fuels we need 263 TWh of energy input. This is because only around 38% of these inputs are converted into ‘useful’ energy.2 163 TWh is energy lost as heat.
- If we only rely on either renewable or nuclear energy these losses do not occur – the quantity of electricity generated is the same quantity we can use. So we only need 100 TWh.
- If we rely on renewables/nuclear and fossil fuels it depends on the mix: let’s say we produce 50 TWh from renewables or nuclear sources. We need another 50 TWh from fossil fuels. But to produce the additional 50 TWh from fossil fuels, we actually need 132 TWh, because we lose 82 TWh as heat [50 TWh / 0.38 = 132 TWh]. Combined, we need 182 TWh of energy input [50 TWh from renewables/nuclear + 50 TWh ‘useful’ fossil fuel energy + 82 TWh wasted].
Based on this example we can understand the difference between direct primary energy and the substitution method.
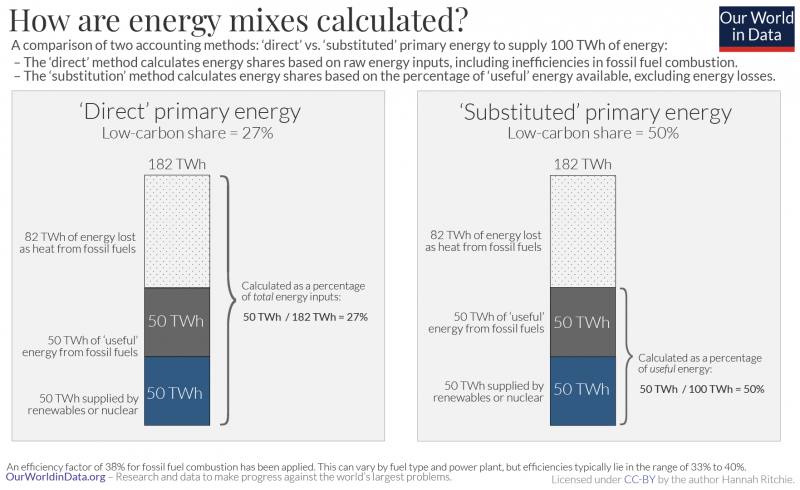
Let’s take the third scenario – a mixture of fossil fuels and low-carbon energy – and see how the low-carbon share differs between the two methods. This is shown in the figure.
From the direct method we get 50 TWh / 182 TWh = 27%. From the substitution method we get 50 TWh / 100 TWh = 50%.
I find it helpful to think of the distinction as:
- Low-carbon’s share in direct primary energy = % of total primary energy consumption (including all of the inefficiencies of fossil fuel production)
- Low carbon’s share in substituted primary energy = % of useful energy (once we subtract all of the wasted energy in the burning of fossil fuels)
A question many want the answer to is, how much of our energy comes from low-carbon sources? How close are we to getting rid of fossil fuels?
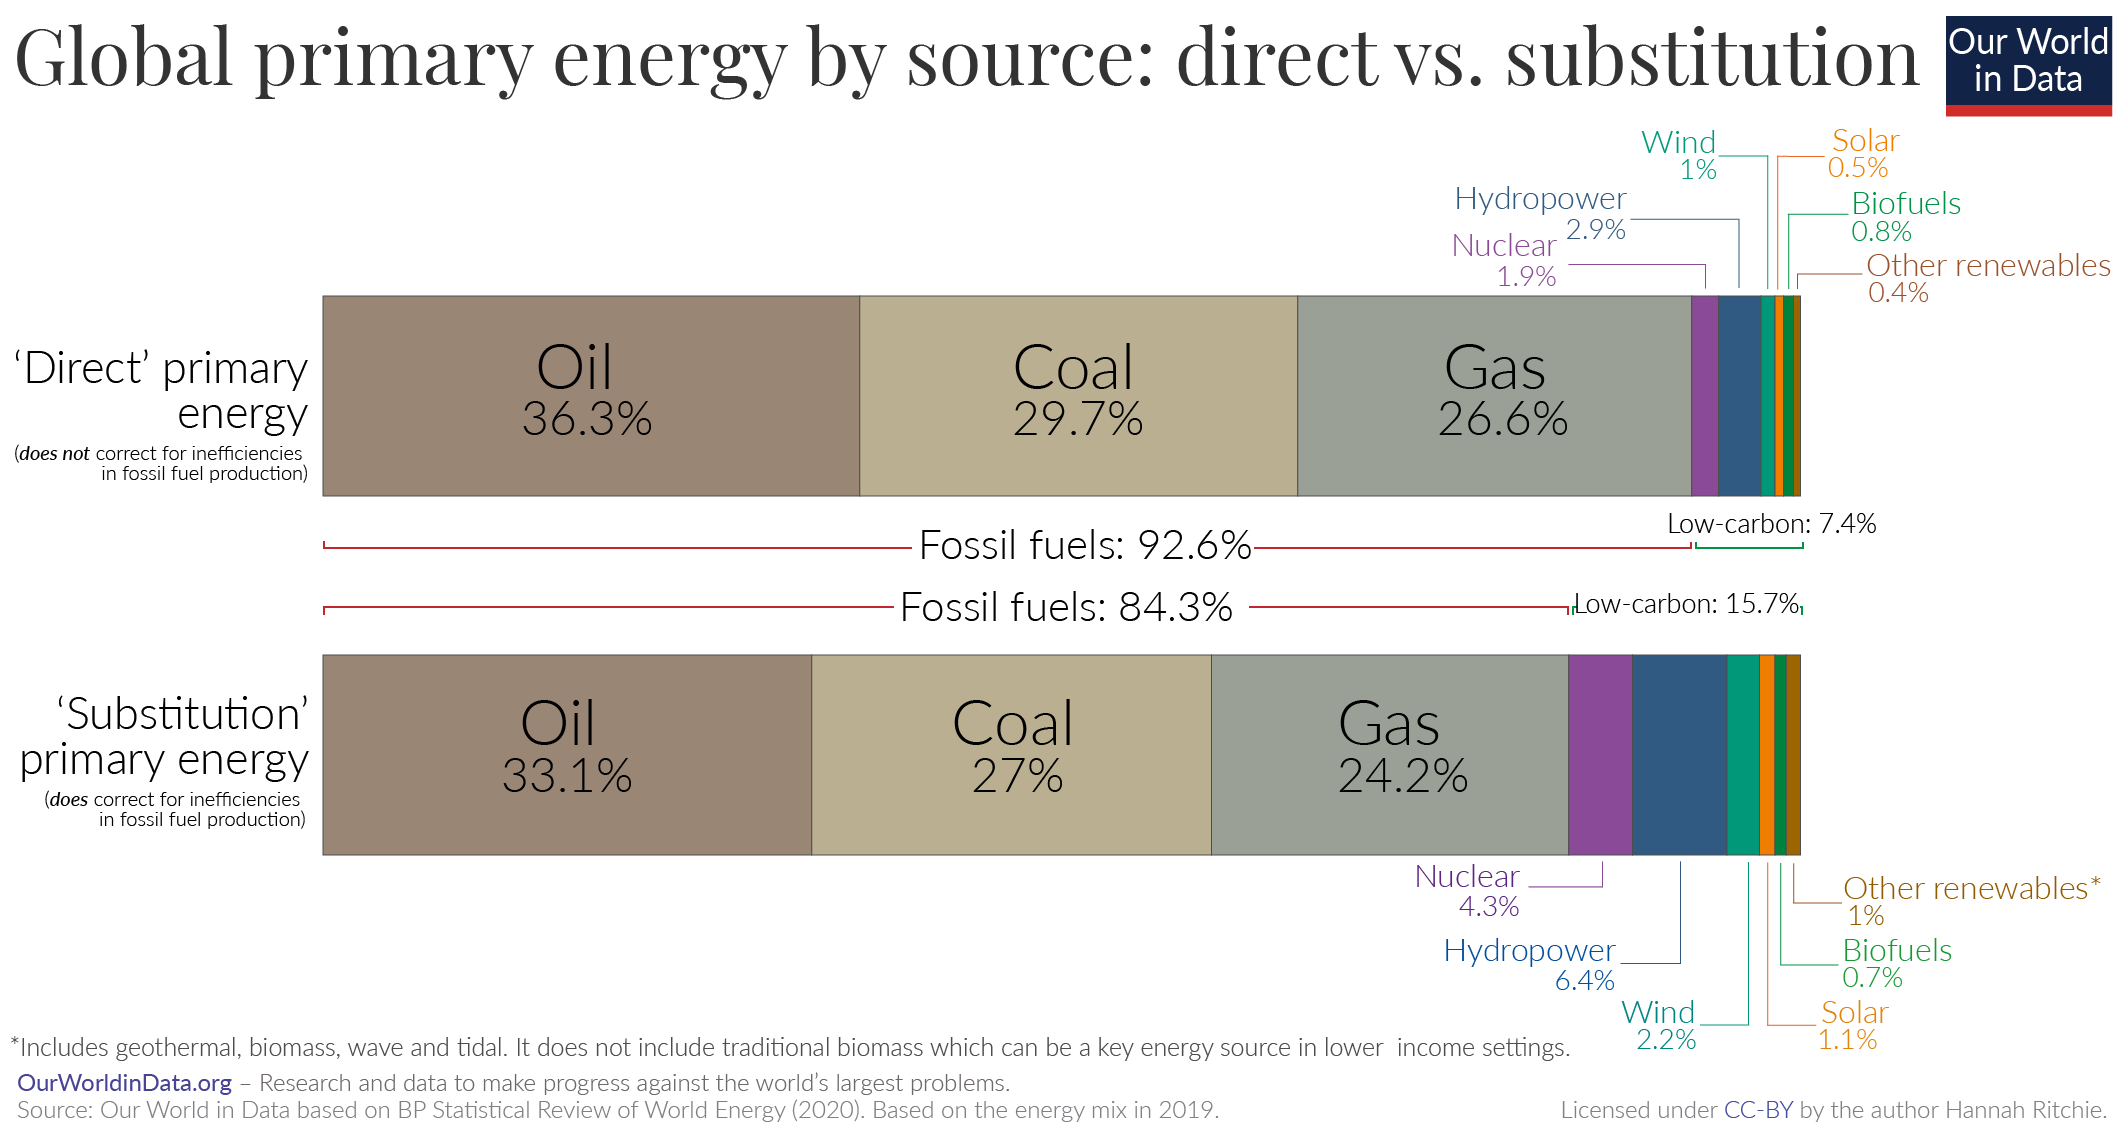
As we now know, it depends on whether we’re using the direct or substitution method. In the chart here we show the breakdown of the global primary energy mix in 2019 to compare the two methods.3
As we should expect from the example we worked through, when we calculate the share of energy from low-carbon sources via the substitution method we get a higher figure: 16% vs. only 7% from the direct method. When we strip away the differences in efficiencies between the sources, both renewables and nuclear make a larger contribution.
In the interactive charts you can also compare each source’s share of energy based on the two methods. Using the “change country” button in the bottom-left of each chart, you can also see this for different countries.
Most sources tend to prefer and report on the substitution method (or a similar approach – the ‘physical content’ method – which we don’t discuss here but which gives similar results) rather than the direct method. The substitution method is also the preferred approach of the Intergovernmental Panel on Climate Change (IPCC), for example.4


At Our World in Data we get most of our energy data from BP; each year it publishes its Statistical Review of World Energy report. It applies the substitution method to its primary energy data [you can read its methodology here].
How does it convert from direct primary energy – that we can measure – into the substitution breakdown?
In the schematic explanation above, we looked at calculating the share of energy from low-carbon energy sources by comparing it with the amount of useful energy (subtracting the wasted energy) from fossil fuels.
But we can also do the opposite of this to get the same result. In fact, this inverse approach is what is most commonly applied by BP and others who use the ‘substitution method’. So, instead of assuming fossil fuels have the same efficiency as renewables/nuclear, we do the opposite: we assume renewables/nuclear are as inefficient as fossil fuels. We calculate the equivalent amount of fossil fuels that would be required to produce the amount of electricity we get from non-fossil based sources.
So, let’s say we produce 100 TWh of electricity from wind. And we assume the efficiency of a fossil fuel plant is 38%. We would convert this wind electricity into ‘input-equivalent’ primary energy by dividing by this efficiency [100 / 0.38 = 263 TWh]. This would be the amount of primary energy that would be required from fossil fuels to produce the same amount of electricity as wind.
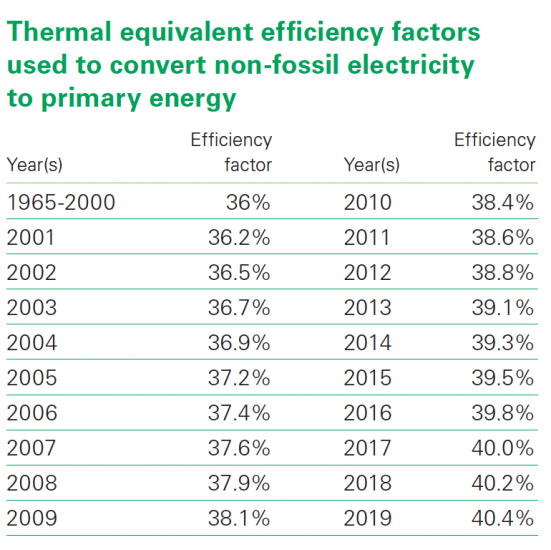
We should note that this conversion is used as an approximation – a standard ‘efficiency’ factor is applied across-the-board. But we know that some power plants have a slightly lower or higher efficiency and it can change over time. In fact, BP changed its methodology in its 2020 assessment to reflect this change over time. Previously it assumed a 38% efficiency factor consistently. But it now applies a ‘time-dependent’ model to build in improvements over time. Changes in this conversion factor are summarised in the table below.
The substitution method gives us a more accurate understanding of how low-carbon energy is competing with fossil fuels. For this reason: when we look at the breakdowns of energy mix on Our World in Data we have tried wherever possible to use primary energy measured by the substitution method.
Conversion factors applied in converting renewable and nuclear electricity outputs to primary energy5