Summary
All energy sources have negative effects. But they differ enormously in size: as we will see, fossil fuels are the dirtiest and most dangerous, while nuclear and modern renewable energy sources are vastly safer and cleaner.
From the perspective of both human health and climate change, it matters less whether we transition to nuclear power or renewable energy, and more that we stop relying on fossil fuels.
Energy has been critical to the human progress we’ve seen over the last few centuries. As the United Nations rightly says: “energy is central to nearly every major challenge and opportunity the world faces today.”
But while energy brings us massive benefits, it’s not without its downsides. Energy production can have negative impacts on human health and the environment in three ways.
The first is air pollution: millions of people die prematurely every year as a result of air pollution. Fossil fuels and the burning of biomass – wood, dung, and charcoal – are responsible for most of those deaths.
The second is accidents. This includes accidents that happen in the mining and extraction of the fuels – coal, uranium, rare metals, oil, and gas. And it also includes accidents that occur in the transport of raw materials and infrastructure, the construction of the power plant, or their maintenance.
The third is greenhouse gas emissions: fossil fuels are the main source of greenhouse gases, the primary driver of climate change. In 2020, 91% of global CO2 emissions came from fossil fuels and industry.1
No energy source is completely safe. They all have short-term impacts on human health, either through air pollution or accidents. And they all have long-term impacts by contributing to climate change.
But, their contribution to each differs enormously. Fossil fuels are both the dirtiest and most dangerous in the short term, and emit the most greenhouse gases per unit of energy. This means that there are thankfully no trade-offs here: low-carbon energy sources are also the safest. From the perspective of both human health and climate change, it matters less whether we transition to nuclear power or renewable energy, and more that we stop relying on fossil fuels.
Nuclear and renewables are far, far safer than fossil fuels
Before we consider the long-term impacts of climate change, let’s look at how each source stacks up in terms of short-term health risks.
To make these comparisons fair we can’t just look at the total deaths from each source: fossil fuels still dominate our global electricity mix, so we would expect that they would kill more people.
Instead, we compare them based on the estimated number of deaths they cause per unit of electricity. This is measured in terawatt-hours. One terawatt-hour is about the same as the annual electricity consumption of 150,000 citizens in the European Union.2
This includes deaths from air pollution and accidents in the supply chain.3
Let’s look at this comparison in the chart. Fossil fuels and biomass kill many more people than nuclear and modern renewables per unit of electricity. Coal is, by far, the dirtiest.
Even then, these estimates for fossil fuels are likely to be very conservative. They are based on power plants in Europe, which have good pollution controls, and are based on older models of the health impacts of air pollution. As I discuss in more detail at the end of this article, global death rates from fossil fuels based on the most recent research on air pollution are likely to be even higher.
Our perceptions of the safety of nuclear energy are strongly influenced by two accidents: Chernobyl in Ukraine in 1986, and Fukushima in Japan in 2011. These were tragic events. However, compared to the millions that die from fossil fuels every year the final death tolls were very low. To calculate the death rates used here I assume a death toll of 433 from Chernobyl, and 2,314 from Fukushima.4 If you are interested in this, I look at how many died in each accident in detail in a related article.
The other source which is heavily influenced by a few large-scale accidents is hydropower. Its death rate since 1965 is 1.3 deaths per TWh. This rate is almost completely dominated by one event: the Banqiao Dam Failure in China in 1975. It killed approximately 171,000 people. Otherwise, hydropower was very safe, with a death rate of just 0.04 deaths per TWh – comparable to nuclear, solar, and wind.
Finally, we have solar and wind. The death rates from both of these sources are low, but not zero. A small number of people die in accidents in supply chains – ranging from helicopter collisions with turbines; fires during the installation of turbines or panels; and drownings on offshore wind sites.
People often focus on the marginal differences at the bottom of the chart – between nuclear, solar, and wind. This comparison is misguided: the uncertainties around these values mean they are likely to overlap.
The key insight is that they are all much, much safer than fossil fuels.
Nuclear energy, for example, results in 99.9% fewer deaths than brown coal; 99.8% fewer than coal; 99.7% fewer than oil; and 97.6% fewer than gas. Wind and solar are just as safe.

Putting death rates from energy in perspective
Looking at deaths per terawatt-hour can seem abstract. Let’s try to put it in perspective.
Let’s consider how many deaths each source would cause for an average town of 150,000 people in the European Union, which – as I’ve said before – consumes one terawatt-hour of electricity per year. Let’s call this town ‘Euroville’.
If Euroville was completely powered by coal we’d expect at least 25 people to die prematurely every year from it. Most of these people would die from air pollution.
This is how a coal-powered Euroville would compare with towns powered entirely by each energy source:
- Coal: 25 people would die prematurely every year;
- Oil: 18 people would die prematurely every year;
- Gas: 3 people would die prematurely every year;
- Hydropower: In an average year 1 person would die;
- Wind: In an average year nobody would die. A death rate of 0.04 deaths per terawatt-hour means every 25 years a single person would die;
- Nuclear: In an average year nobody would die – only every 33 years would someone die.
- Solar: In an average year nobody would die – only every 50 years would someone die.
The safest energy sources are also the cleanest
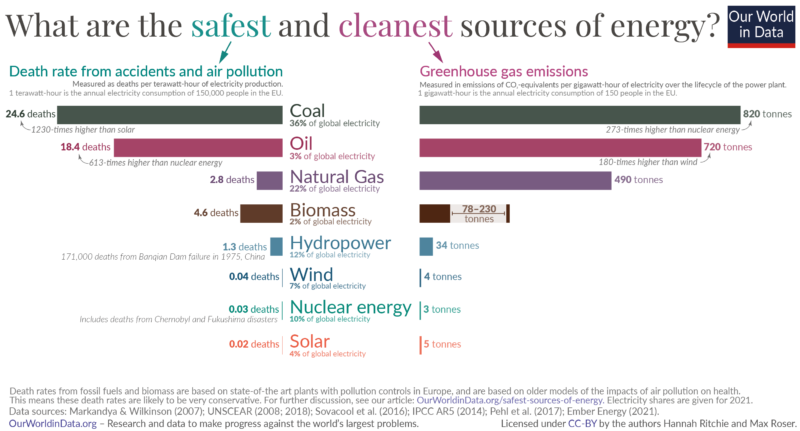
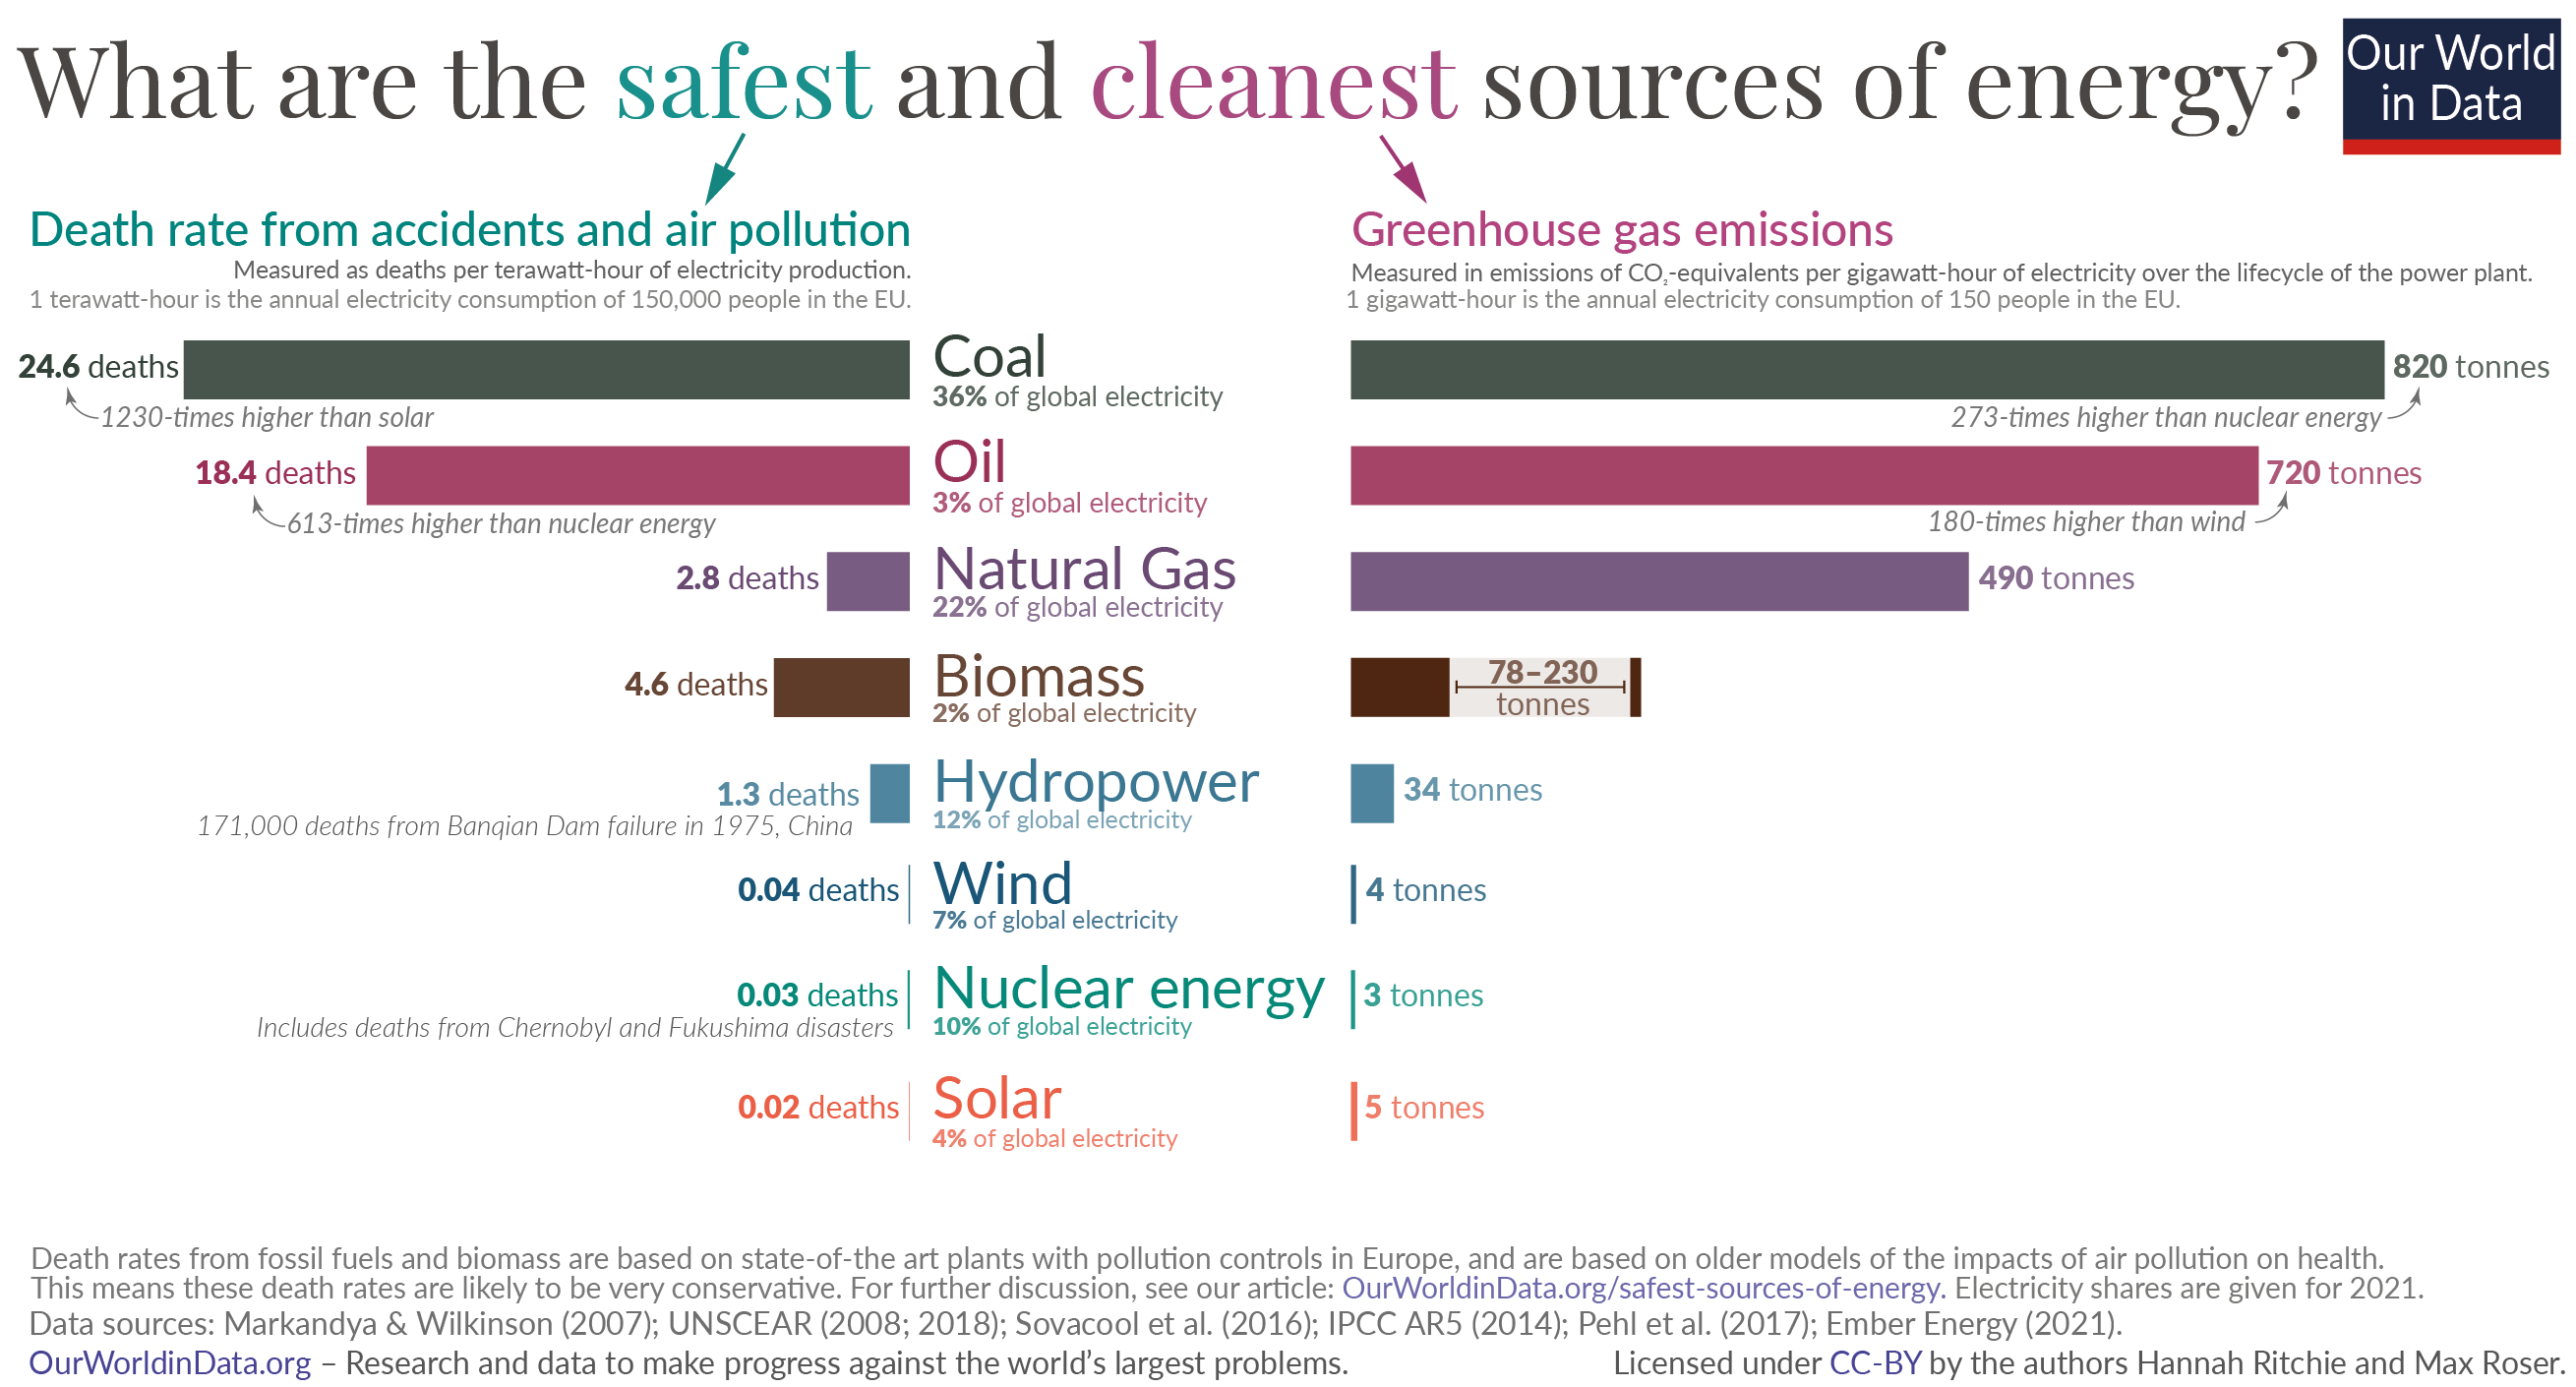
The good news is that there is no trade-off between the safest sources of energy in the short term, and the least damaging for the climate in the long term. They are one and the same, as the chart below shows.
In the chart, on the left-hand side, we have the same comparison of death rates from accidents and air pollution that we just looked at. On the right, we have the amount of greenhouse gas that are emitted per unit of electricity production.
These are not just the emissions from the burning of fuels, but also from the mining, transportation and maintenance over a power plant’s lifetime.5
Coal, again, is the dirtiest fuel. It emits much more greenhouse gases than other sources – hundreds of times more than nuclear, solar, and wind.
Oil and gas are also much worse than nuclear and renewables, but to a lesser extent than coal.
Unfortunately, the global electricity mix is still dominated by fossil fuels: coal, oil, and gas account for around 60%. If we want to stop climate change we have a great opportunity in front of us: we can transition away from them to nuclear and renewables, and also reduce deaths from accidents and air pollution as a side effect.6
This transition will not only protect future generations, but it will also come with huge health benefits for the current one.
Methodology and notes
Keep reading at Our World in Data…


Update: This article was first published in 2017. It was last updated in July 2022 based on more recent analysis and estimates.