What could be more tragic than a mother losing her life in the moment that she is giving life to her newborn?
This risk – maternal mortality – is the focus of this entry. We are presenting the global data, study the development over the last generations, ask how it was possible to make child birth so much safer, and what we can do to reduce the risk of maternal death further still.
Interactive charts on Maternal Mortality


For most of our history, pregnancy and childbirth were dangerous for both baby and mother. If we look at long-term trends in maternal mortality – the likelihood a woman will die from pregnancy-related causes – we see that every 100th to 200th birth led to the mother’s death.
Improvements in healthcare, nutrition, and hygiene mean maternal deaths are much rarer today. But women are still dying from pregnancy-related causes that are preventable.
The World Health Organization estimates that almost 300,000 women died from pregnancy-related causes in 2017. That’s 808 women every day.
In the chart here we see global maternal deaths by region. Two-thirds – 200,000 – occurred in Sub-Saharan Africa. 19% – 57,000 – occurred in South Asia.
This is partly attributed to the fact that many more babies are born in Asia and Africa than in other regions. But it is also largely the result of the much higher maternal mortality rates found in lower-income countries. Per birth, a woman in Nigeria is more than 200 times more likely to die in pregnancy or childbirth than a woman in Sweden.

Maternal deaths by country
In the map we see the annual number of maternal deaths by country. Again, this is a reflection of both the number of births each year, and the probability that a mother will die as a result.
The five countries with the highest number of maternal deaths in 2017 were: Nigeria (67,000); India (35,000); Democratic Republic of Congo (16,000); Ethiopia (14,000); and Tanzania (11,000).

Where are women most at risk of dying in childbirth?
The risk of a woman dying in childbirth has declined significantly across the world, yet inequality in health remains large across countries, and in some regions childbirth still comes with a high risk for both the mother and newborn.
Where are women most at risk of dying in childbirth today?
Here there are two metrics we need to distinguish: the maternal risk per pregnancy, but also the lifetime risk to a woman, which depends on the number of children she has.
Mortality risk per pregnancy
In the visualization we see the latest maternal mortality rates across the world. What becomes clear from the map scale – spanning orders of magnitude – is the extent of cross-country inequality: the magnitude of the differences in mortality between countries are very large. In most high-income countries, maternal mortality is now very low. The average rate in the European Union is 8 maternal deaths per 100,000 live births. In some countries such as Poland, Italy, and Sweden, the rate is even lower at 3 to 4 per 100,000.
In Sierra Leone a woman is 300 to 400 times more likely to die with each pregnancy. At an estimated rate of 1120 deaths per 100,000 live births, around 1-in-80 pregnancies ends in the death of the mother.
The five countries where a woman is most likely to die in a given pregnancy are:
- South Sudan;
- Chad;
- Sierra Leone;
- Nigeria;
- and Somalia.

Share of women that are expected to die from pregnancy or childbirth
Of course, the chances that a woman dies from maternal causes are not only dependent on the risk per pregnancy – which we looked at above – but also the number of pregnancies she has.
The average woman in the UK or Sweden has one or two children. In Niger, she has seven children. Not only is the risk per pregnancy higher at lower incomes, but also the number of births. Maternal mortality rates tend to be higher where women have more children. These amplify the differences in risk between high and low-income countries.
In the visualization we see estimates of the share of women that will die from maternal causes in their lifetime, for the country averages. This is based on the probability that a 15-year-old female dies from pregnancy-related causes if fertility and maternal mortality risks stay constant at their current levels.
Across most of the world, the risk is less than 1%. In most countries, it’s even well below 0.1%.
But, in Sierra Leone, 5% of 15-year-old women today will die from maternal causes sometime in the future, if fertility and maternal mortality rates stay the same. The Democratic Republic of Congo, Chad, Nigeria, Niger and Somalia it’s also over 4%. That’s around every 20th woman.

If we can make maternal deaths as rare as they are in the healthiest countries we can save almost 300,000 mothers each year
830 women die from pregnancy-related causes every day.1 In 2015, 302,700 women in the world died as a result of pregnancy or childbirth.
For many aspects in global development it is true that the world made a lot of progress in the past and we know that we can make a lot of progress still. We’ve shown this before for child mortality and it is true for maternal health too: maternal health is much better than the past; it’s still awful today; and we can do much better.
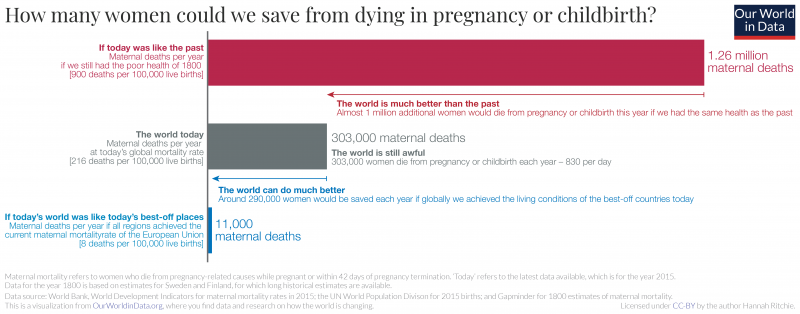
In the visualization here we compare three scenarios:
- How many mothers would die today if we still had the very poor health of the past? Even the countries with the best maternal health today had very high maternal mortality rates in the past. In Sweden and Finland in 1800, for example, around 900 mothers died for every 100,000 live births [nearly 1-in-100].2 In today’s world where 140 million women give birth each year this would mean that 1.26 million would die.
- The world today: the actual number of women that died from pregnancy-related causes in 2015 was 302,700.
- If all regions had the health of today’s best-off countries: Today the world region with the lowest maternal mortality is the European Union, where 8 women die per 100,000 live births. In today’s world where 140 million women give birth each year, if all countries had this level of maternal mortality, 11,000 would die.3
We can see how much global maternal health is improved: if we still had the living standards of 1800, around 1.26 million women would die from pregnancy every year. Almost one million more women would die each year.
But we also see how far we could go. If all regions achieved the healthcare and living standards of the EU very few women would die. Almost 300,000 fewer deaths ; a reduction of over 95%. If we think of it in this way, almost all of the world’s maternal deaths are preventable with adequate maternal care, safe deliveries, good nutrition and hygiene and sanitation.4 This is also the message of the World Health Organization: “Every day, approximately 830 women die from preventable causes related to pregnancy and childbirth.”
That most of the world’s maternal deaths could be prevented also becomes clear when we consider that 95% occur in low and lower-middle income countries. Maternal mortality is much more common in poorer countries.
It’s unacceptable that a woman in Sierra Leone is 300 to 400 times more likely to die during pregnancy or childbirth than a woman in Sweden or Finland, and we know it is possible to prevent these deaths.
If we can make maternal deaths as rare as they are in the healthiest countries in the world we can save almost 300,000 mothers each year.
Health complications and mortality risk from childbirth has been a tragic but not uncommon event for mothers throughout history.
The decline of maternal mortality over the last generations is shown in the chart. We see that in the 19th century about 500 to 1,000 mothers died for every 100,000 births. Every 100th to 200th birth led to the mother’s death.
Since women gave birth much more often than today maternal death was not uncommon. This changed over the last century and today most rich countries have a maternal mortality ratio below 10 deaths per 100,000 births – the countries with the lowest maternal mortality reached a level of around 1% of the death rate in the 19th century.
The countries that achieved the lowest maternal mortality ratio are Finland, Greece, Iceland, and Poland. For every 100,000 births, 3 mothers die.
The 100-fold decline of maternal mortality is due to the modern scientific understanding of the cause of maternal mortality and the adoption of practices which appear surprisingly simple in hindsight.
We see the decline in Finland over the course of the 2nd half of the 19th century. In the 20th century the availability of antibiotics made it possible to treat cases of puerperal fever and the death of a mother is today fortunately very rare. As it is often the case we see that it is much harder for a pioneer to make advancements than for a country that catches up later. The decline of maternal mortality in Finland began in the middle of the 19th century and didn’t reach today’s low level more than a century later. Malaysia in contrast achieved this progress in only a few decades.

Decline of maternal mortality across the world
Maternal mortality has fallen globally, and for some countries there has been a dramatic decline. But is this true for all countries? Is maternal mortality falling everywhere?
The visualization here compares the maternal mortality ratio in 1990 and one generation later, in 2016. The grey line shows where countries would fall in which the rate remained unchanged. Here we see that almost all countries lie above this line: that is, the maternal mortality rate in 1990 was higher than in 2016. For the majority of countries in the world the maternal mortality rate has fallen over the past generation.
There are, however, a few countries where a young women today is more likely to die in childbirth than her mother was a generation ago: the United States, Serbia, Georgia, Saint Lucia, the Bahamas, North Korea, Jamaica, Tonga, Venezuela, South Africa, Suriname, Guyana and Zimbabwe.

Basic hygiene – the lifesaving discovery of Ignaz Semmelweis
What could be more tragic than a mother losing her life in the moment that she is giving life to her newborn? The visualization shows how common this once was. In Finland – the country in which women today have the lowest risk to die from pregnancy-related causes – we see that during much of the 19th century, maternal mortality hung between 800 and 1,000 deaths for every 100,000 births. In other words, at each birth women faced a 0.9% chance of death. And since women in Finland gave birth to 5 children on average at the time, this meant that the death of mothers was no rare occurrence.
The visualization also shows how maternal mortality has changed since then. Starting in the second half of the 19th century, the risk of dying during or after pregnancy has declined from 0.9% to 0.003%. Today, giving birth is 300-times safer than just a few generations ago. How was this possible?

The story of the decline of maternal mortality is a story about scientific research and the importance of measurement. Today medicine makes progress by relying on randomized controlled trials – the history of the decline of maternal mortality started with a kind of controlled trial, one that wasn’t planned, but which happened almost accidentally.
In the mid-19th century, the largest maternity hospital in the world was in Vienna. At the time puerperal sepsis was the most common cause of maternal deaths. This infection of the uterus killed new mothers shortly after childbirth.5
The Vienna Maternity Hospital was divided into two wings and for some time the doctors had noticed a stark difference between the wings that they were not able to explain. Doctors and medical students were taught in the first wing, while midwives were taught in the second. In the first wing, every tenth (!) mother died of puerperal sepsis, while in the second ‘only’ one in 25 died. Crucially, women were admitted to the clinics not on the basis of how complicated their case was, but simply on alternate days – in other words, by random allocation. Unintentionally, the hospital had created the conditions suitable for a natural experiment.
In 1846, the young Viennese doctor Ignaz Semmelweis was appointed to the hospital. He had the suspicion that the differences in the routine practices of the two wings would give him insight into what was causing the alarmingly high mortality rates in one. He noticed that in the first wing, where 10% of young mothers perished, medical students alternated between helping women to give birth and attending post-mortem examinations of women who had died of puerperal sepsis. They carried out their work in ordinary daytime clothing rather than clean, white coats, and between autopsies and deliveries, they did not wash their hands. By contrast, the pupil midwives in the second clinic did not perform postmortem examinations. And thus, many years before the role of bacteria in diseases was known, Semmelweis concluded that the disease under his study was contagious, and that it was the doctors who were transmitting it.
Semmelweis also found that a chemical would destroy the agent that led to the disease, and therefore insisted that his students disinfect their hands with it before attending the labour wards. This led to dramatic results. By 1848, the maternal mortality rates of the two clinics in the Vienna Maternity Hospital were comparable.6
However, Semmelweis’s insistence on his discovery that puerperal sepsis was contagious did not fit into the accepted medical understanding of the time, and this meant an agonizingly slow process of convincing the medical establishment of the importance of better hygiene and measures of antisepsis. Only in the second half of the 19th century was antisepsis widely introduced into routine obstetric practice. But this change, coupled with the discovery of antibiotics and the development of blood transfusion in the first half of the 20th century, sharply drove down the risk of dying in childbirth.
Semmelweis’s story tells us two things. First, it shows how powerful measurement can be. Decades before the modern germ theory of disease was accepted, and with no understanding of the mechanism that caused puerperal sepsis, it was the measurement of the distribution of maternal deaths that gave Semmelweis the crucial insight about what steps could be taken to effectively reduce maternal mortality.
Second, it tells us how frustratingly long it can take until new discoveries become accepted and finally change practices. Semmelweis’s discovery, which could have led to immediate and widespread improvements, was not widely circulated. More time would have to pass, with more knowledge accumulated, before steep reductions in maternal mortality could take place.
We collaborated with the team from Kurz Gesagt and the Bill and Melinda Gates Foundation to tell this history of maternal mortality in a video for the Goalkeepers event in 2017:
What share of births are attended by health staff?
An important factor in a safe delivery for both the mother and baby is good advice, care and supervision by trained medical staff. But not all births are attended by skilled personnel to do so.
In the first chart here we see the relationship between the maternal mortality rate and the share of births which are attended by skilled health staff. Here we see a strong cluster in the bottom-right corner: this means where the maternal mortality rate is low, almost all births are attended by skilled personnel. But we also see countries with much lower staff coverage: in Chad, for example, only every 5th pregnancy was delivered with trained staff. For countries where health staff coverage was lower, we see that typically maternal mortality was much more likely.


In the second chart we see global coverage of the share of births which are attended by skilled health staff. Again, we see that for most countries this is close to 100%. But there are still some countries where healthcare access is very low.
Does maternal mortality fall as countries get richer?
This chart shows the relationship between the maternal mortality ratio and average income across the world is shown
We see a strong correlation: the maternal mortality rate is lower in countries with higher incomes. But not every country that achieved economic growth also achieved a reduction of maternal mortality. The large spread of countries at a given level of income makes clear that there is more than income that matters here: healthcare and nutrition also play a big role.

Maternal mortality reduces education for children
For Kenya Evans and Miguel (2007)7 estimated that school participation falls by 5.5 percentage points immediately following the death of a parent. This decrease appears to be driven by the death of the mother: the post-death decrease in school participation to be 9.3 percentage points and the pre-death decrease to be 6.5 percentage points.
Beegle and Adhvaryu (2012)8 find that in Tanzania, children who lose a mother before turning 15, on average, complete one less year of schooling than other children.
Gourlay et al (2014)9 find that in Zimbabwe, female double-orphans (girls that have lost both parents) are 13 percentage points less likely to be enrolled in school than non-orphans.
There are two metrics of maternal mortality that are commonly used10:
- The Maternal Mortality Ratio (MMRatio) refers to the ratio of the number of maternal deaths to the number of births in the same period.
- The Maternal Mortality Rate (MMRate) on the other hand refers to the number of maternal deaths in a period to the number of person years lived by women of reproductive age (normally 15 to 49) in the same period.
The UN Maternal Mortality Estimation Inter-agency Group publishes Trends in maternal mortality: 1990 to 2015. These data are published by the World Bank here.
According to the report the data comes from several sources. In the best cases data from the civil registration systems were used directly to calculate the estimates of maternal mortality rates (MMRs). When these data were not available two-part multi-level regression model were used to estimate MMRs for all target years. The three selected predictor variables in the regression model are: GDP, the general fertility rate (GFR) and the proportion of skilled attendants at birth.
- Data: Maternal mortality ratio (per 100,000 live births)
- Geographical coverage: Global – by country
- Time span: Mostly the last decades but historical time series are available for the following countries: Australia (since 1871), Belgium (since 1851), Denmark (1921-1949 & since 1970), Finland (since 1751), Germany (since 1952), Ireland (since 1871), Japan (since 1935), Malaysia (since 1933), The Netherlands (since 1867), New Zealand (since 1972), Sri Lanka (since 1900), Sweden (since 1751), United Kingdom (since 1847), United States (since 1900) – this data is visualized above in this data entry.
- Available at: Online at Gapminder.org.
- The various original sources of this data are documented by Gapminder here.
- Gapminder also includes data on ‘Births attended by skilled staff’.
- Data: Maternal mortality ratio (modeled estimate, per 100,000 live births)’
- Geographical coverage: Global – by country and world region.
- Time span: Since 1990 – observations every 5 years for almost all countries.
- Available at: Online here.
- Related data in the WDI is available on ‘Pregnant women receiving prenatal care (%)’ and ‘Births attended by skilled health staff (% of total)’.