We are currently working on a historical dataset on conflict deaths and casualties. If you want to contribute to this research please get in touch.
This entry presents an empirical perspective on the history of war and peace. We also published a visual history of human violence which shows that we may now live in the most peaceful time in our species’ existence.
Interactive charts on War and Peace


The absolute number of war deaths has been declining since 1946. In some years in the early post-war era, around half a million people died through direct violence in wars. In recent years, the annual death toll tends to be less than 100,000.
The decline of the absolute number of battle deaths can be seen in the first visualization here that shows global battle deaths per year by world region, which pulls together data from two sources: more recent data from the Uppsala Conflict Data Program (UCDP) and older data from the Peace Research Institute Oslo (PRIO). We see three marked peaks in war deaths since the end of World War II: the Korean War (early 1950s), the Vietnam War (around 1970), and the Iran-Iraq and Afghanistan wars (1980s). The 2010s were also a period of high battle-deaths, driven by the conflicts in Syria, Iraq and Afghanistan.
Within the sources on which this chart draws, the region of the conflict has been coded in quite a particular way, relating to the source’s methodology for identifying and distinguishing conflicts. In most instances, the region attributed to the conflict will be the same region as where the fighting took place. But in some cases it refers to the region where the armed forces fighting in the conflict have come from.1
In a second chart here, we show a similar breakdown but where the region is defined exclusively in terms of where the fighting actually took place. This ‘geo-referenced’ data is available only in the UCDP data from 1989. Comparing the charts for this later period, we see that the regional breakdowns are very similar across the two approaches used to attribute conflicts to regions.


The chart above refers only to battle deaths occurring in conflicts that involved at least one state on one of the opposing sides. For more recent years, we show these ‘state-based’ conflict deaths alongside battle deaths in ‘non-state’ conflicts (where two or more organisations are fighting but no state is involved), and also violent deaths in ‘one-sided violence’ (where there is only one organised aggressor, such as in genocidal violence).
We see that, in recent years, state-based conflicts form the majority of such deaths, though the genocide in Rwanda in 1994 stands out for its very high death-toll.

The previous two graphs showed absolute numbers, but as the world has seen rapid population growth (see our entry on global population growth), it is more appropriate to look at relative numbers. Here we show the battle deaths in state-based conflicts per 100,000 people per year. The figures are shown by type of conflict.

The stacked area chart here shows the number of ongoing conflicts each year has risen. This increase however only relates to civil conflicts within states. Conflicts related to the expansion or defence of colonial empires ended with decolonisation. Conflicts between states have almost ceased to exist.
But the number of war victims varies hugely between different wars: whereas 1,200,000 died during the the Korean War (1950–1953), other wars had ‘just’ 1,000 victims. For this reason, statistics on the number of wars need to be interpreted alongside data on the size of these conflicts.
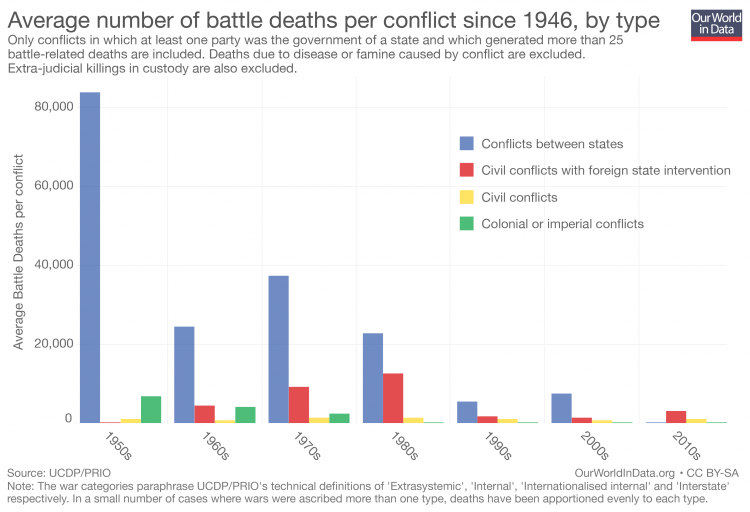
The increase in the number of wars is predominantly an increase of smaller conflicts. This follows from the previously shown declining number of war victims while the number of conflicts increased. The decreasing deadliness of conflicts can be seen in the bar chart.

Deadliness of wars – average battle deaths per conflict by decade, 1950-2016
It would be wrong to believe that the past was peaceful. One reason why some people might have this impression is that many of the past conflicts feature less prominently in our memories; they are simply forgotten.
Counting world conflict deaths: why do sources differ?
To answer the question of how many people die in conflicts today, and how this has changed over time, we can turn to a number of different datasets.
Here we show the world conflict death rate since 1989 according to five sources.
The ‘UCDP all’ series is an aggregation of the deaths recorded in each of the three categories of conflict used by Uppsala Conflict Data Program: state-based conflict, non-state conflict and one-sided violence. (We show the data for these categories separately here).
We’ve summarised more information about the data sources and how we handled them to produce the chart above in a document, World conflict deaths since 1989: Notes on five sources.
You see in the chart that there are certainly similarities across the different sources. Overall they show a decline in conflict deaths into the 2000s, followed by an increase in the 2010s.2
But there are also large differences. Most noticeably, there is a large jump in 1994 – marking the Rwandan genocide – which is present in some series, but absent from others.
If you look closely, you’ll see that there are large relative differences between the series over the entire period as well, though they are understated by the 1994 peak. If you hover over the datapoints, you can see the exact figures: the highest figure for a given year is typically well more than double the lowest.

Discrepancies between different sources of conflict deaths data are partly to do with the differences in how the underlying source information – for instance newswires, death registers, government or NGO reports, or indeed other conflict databases – are selected and interpreted.
But they also reflect conceptual differences in terms of which deaths are and aren’t included in the source’s definition.
And the differences reflect that conflict and deaths are not equally well-documented across world regions. Conflicts and deaths in Europe are often documented well, while this sometimes is less the case for conflicts in other regions, especially in Africa and Asia.
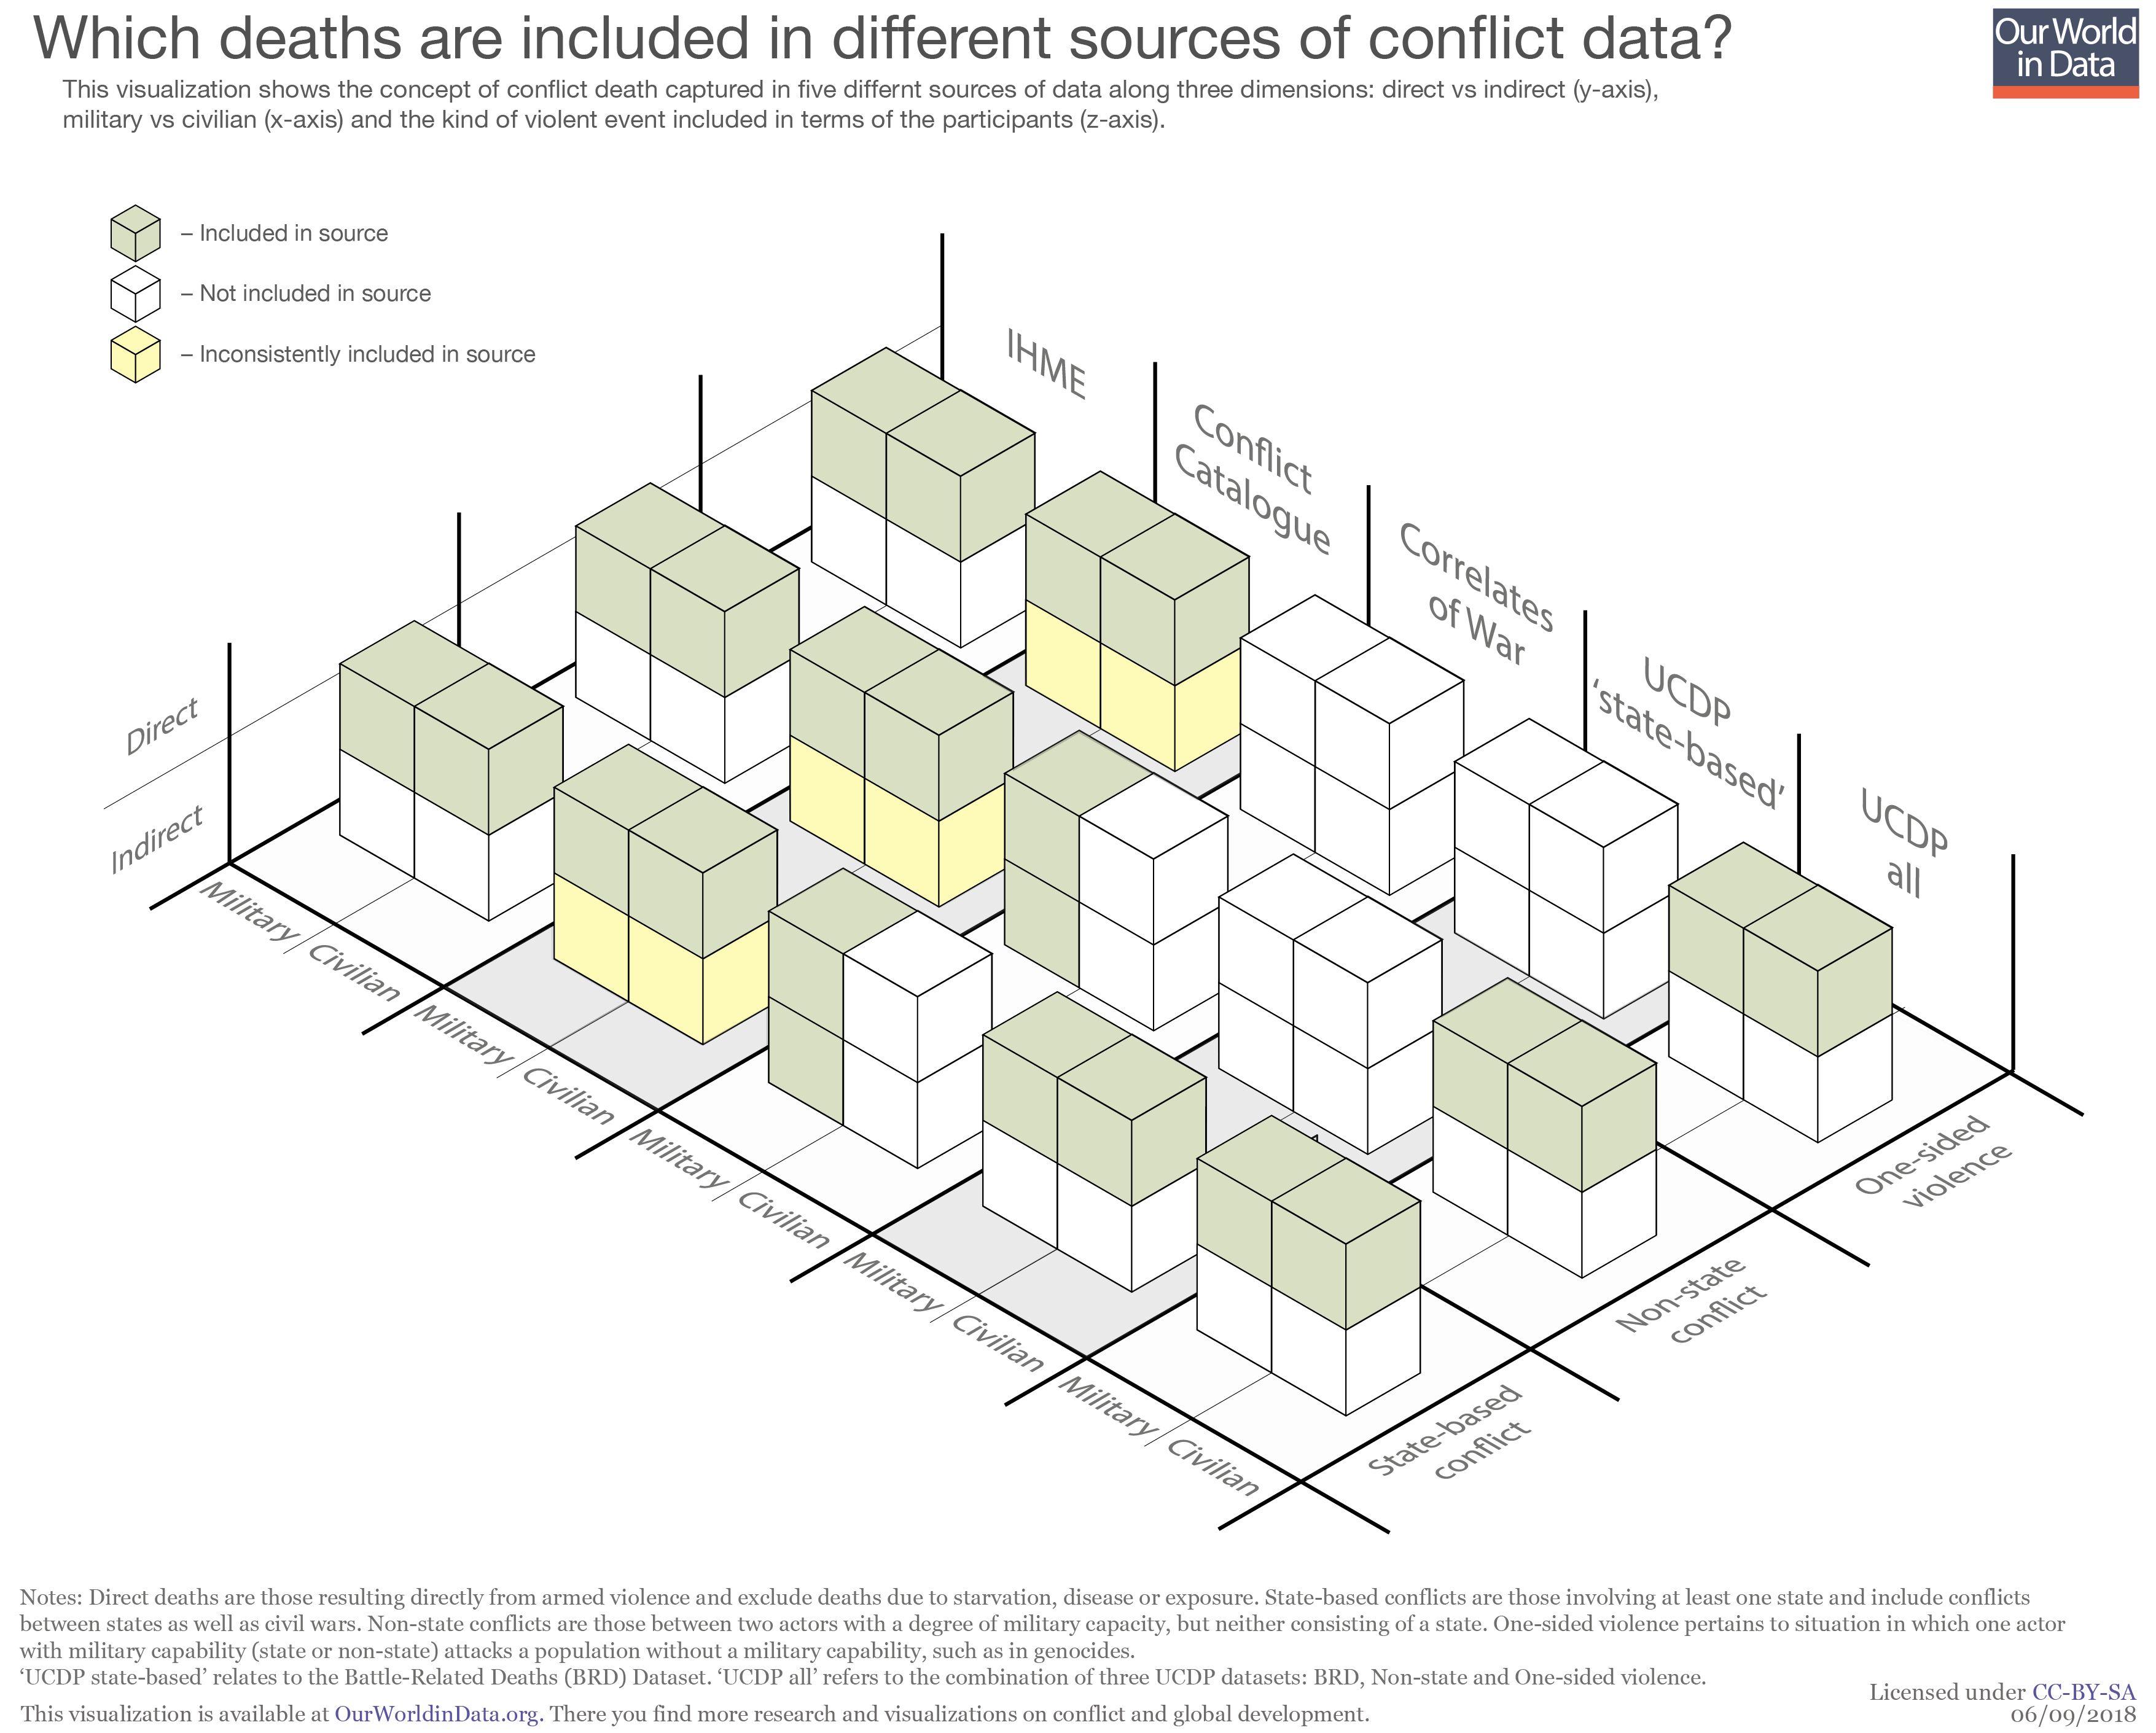
Below we relate some of the differences visible in the chart above in terms of some key conceptual differences lying along three dimensions: Who, How and What.
Who: civillian vs military deaths
The Correlates of War series aims to include only deaths of military personnel, whereas the other sources capture – at least to some extent – civilian deaths too. As we would expect then, the Correlates of War figures are generally lower than the others.
How: direct vs indirect deaths
In addition to those deaths caused directly by violence – for instance those from gunshot or explosions – a significant proportion of lives lost in conflict are indirect: due to disease, starvation or exposure. This is particularly true where conflicts lead to famine or outbreaks of disease among the civilian population. But historically, such indirect deaths were also a major cause of military fatalities.3
The UCDP and IHME data include only direct deaths. The Correlates of War series includes military personnel that died from diseases ‘contracted in the war theatre’. The Conflict Catalog series (running to 2000 only) tries to include indirect deaths of both the military and civilian populations. Peter Brecke, the author of the dataset, however acknowledges that the degree to which this is in fact achieved varies considerably across conflicts.4
While indirect deaths represent a substantial proportion of the social costs of conflict, there is a conceptual difficulty in drawing a consistent boundary between indirect deaths attributable to the conflict and those due to other factors. For instance, whilst famines are often triggered by conflicts, many factors contribute to their onset and severity, such as the level of sanitation or the transportation infrastructure present.
Brecke does not attempt to provide a clear-cut definition, and this conceptual boundary has been largely dictated by the available primary sources he used in each estimate. Nevertheless, as we would expect, the death rates reported in the Conflict Catalog do come out the highest.
What: state involvement and one-sided violence
Across the various sources there three broad kinds of violent event distinguished: state-based conflict, non-state conflict and one-sided violence. The kind of event depends on the type of actors involved. State-based conflict is that involving at least one state-actor, and includes conflicts between states (“inter-state” conflicts) and those between a state and non-state actor (“extra-state” conflicts), such as civil wars or colonial wars.
Non-state actors are those that demonstrate a degree of coordinated military organisation but whose identity falls short of statehood. Non-state conflicts are those between two or more non-state actors, with no state involvement.
‘One-sided violence’ on the other hand is where one organized actor (either a state or non-state group) attacks people that do not have any organized military capability to defend themselves, as in the case of genocide or ‘politicide‘.
The UCDP state-based and Correlates of War series do not include such events. It is for this reason that they do not show the jump in 1994 that marks the Rwandan genocide.
Here we picture the definitions used in the various sources across these three dimensions.
There are also efforts to collect data specifically on the number of people dying from acts of terrorism – this is discussed in our entry on Terrorism.
How does the concept of terrorism relate to the concepts of conflict used in the data shown above? To what extent are terrorism deaths included in this data?
In general, definitions of terrorism include only violent episodes that are carried out by non-state actors, and definitions often emphasise events where civilians or to military personnel who are unarmed or not on duty are the target.5
As such, definitions of conflict deaths that include both civilian deaths and deaths caused by non-state actors will include a large fraction of the deaths normally attributed to terrorism. That is true for instance of the ‘UCDP all’ series in the charts shown above. This dataset, for example, includes direct deaths occurring in the September 11 attacks in the United States, and in the Taliban insurgency following the 2001 war in Afghanistan.
There are however some situations where deaths that would fall under typical definitions of terrorism might not get included even in the UCDP’s broad definition of conflict. In particular, as mentioned above, the UCDP classification system has a requirement that non-state actors must have a certain degree of institutional organisation for an event to be included in its dataset. Deaths caused by attackers falling below this threshold of organisation – such as in ’lone wolf’ attacks perpetrated by ideologically-motivated individuals – would not be included in the UCDP data but might fit under common definitions of terrorism.
Because deaths due to conflict and terrorism can be attributed and grouped into ’events’ or ‘episodes’ in different ways in different datasets, it is difficult to make direct comparisons and know exactly the extent to which deaths included in one dataset are included or excluded in another. But because the larger events that would fall under typical definitions of terrorism – for instance those that are conducted by well-organised groups or are part of long-running insurgencies – will also be included in broad definitions of conflict like those used by UCDP, the latter are likely to include the majority of deaths commonly attributed to terrorism.
- Data: Inter-state, intra-state, non-state, and extra-state wars
- Geographical coverage: Global
- Time span: 1816-2007
- Available at: Online here
- Data: Conflicts
- Geographical coverage: Global
- Time span: 1400-2000
- Available at: Online here
- Data: Deaths from conflict and terrorism
- Geographical coverage: Global
- Time span: since 1990
- Available at: Online here