The observation that the number of transistors on computer chips doubles approximately every two years is known as Moore’s Law.
Moore’s Law is not a law of nature, but an observation of a long-term trend in how technology is changing.
The law was first described by Gordon E. Moore, the co-founder of Intel, in 1965.1
The chart shows Moore’s original graph that he drew in 1965 to describe this regularity. At the time, he had only a handful of data points. Note that he drew it on a logarithmic scale, and remember that a straight line on a log-axis means that the growth rate is constant and it is therefore showing the exponential growth of the number of transistors.
However, he hypothesized that this relationship would continue at a similar rate: “There is no reason to believe it will not remain constant for at least 10 years”.2

Moore’s Law has held true for more than half a century
In 1965, Gordon Moore predicted that this growth would continue for another 10 years, at least. Was he right?
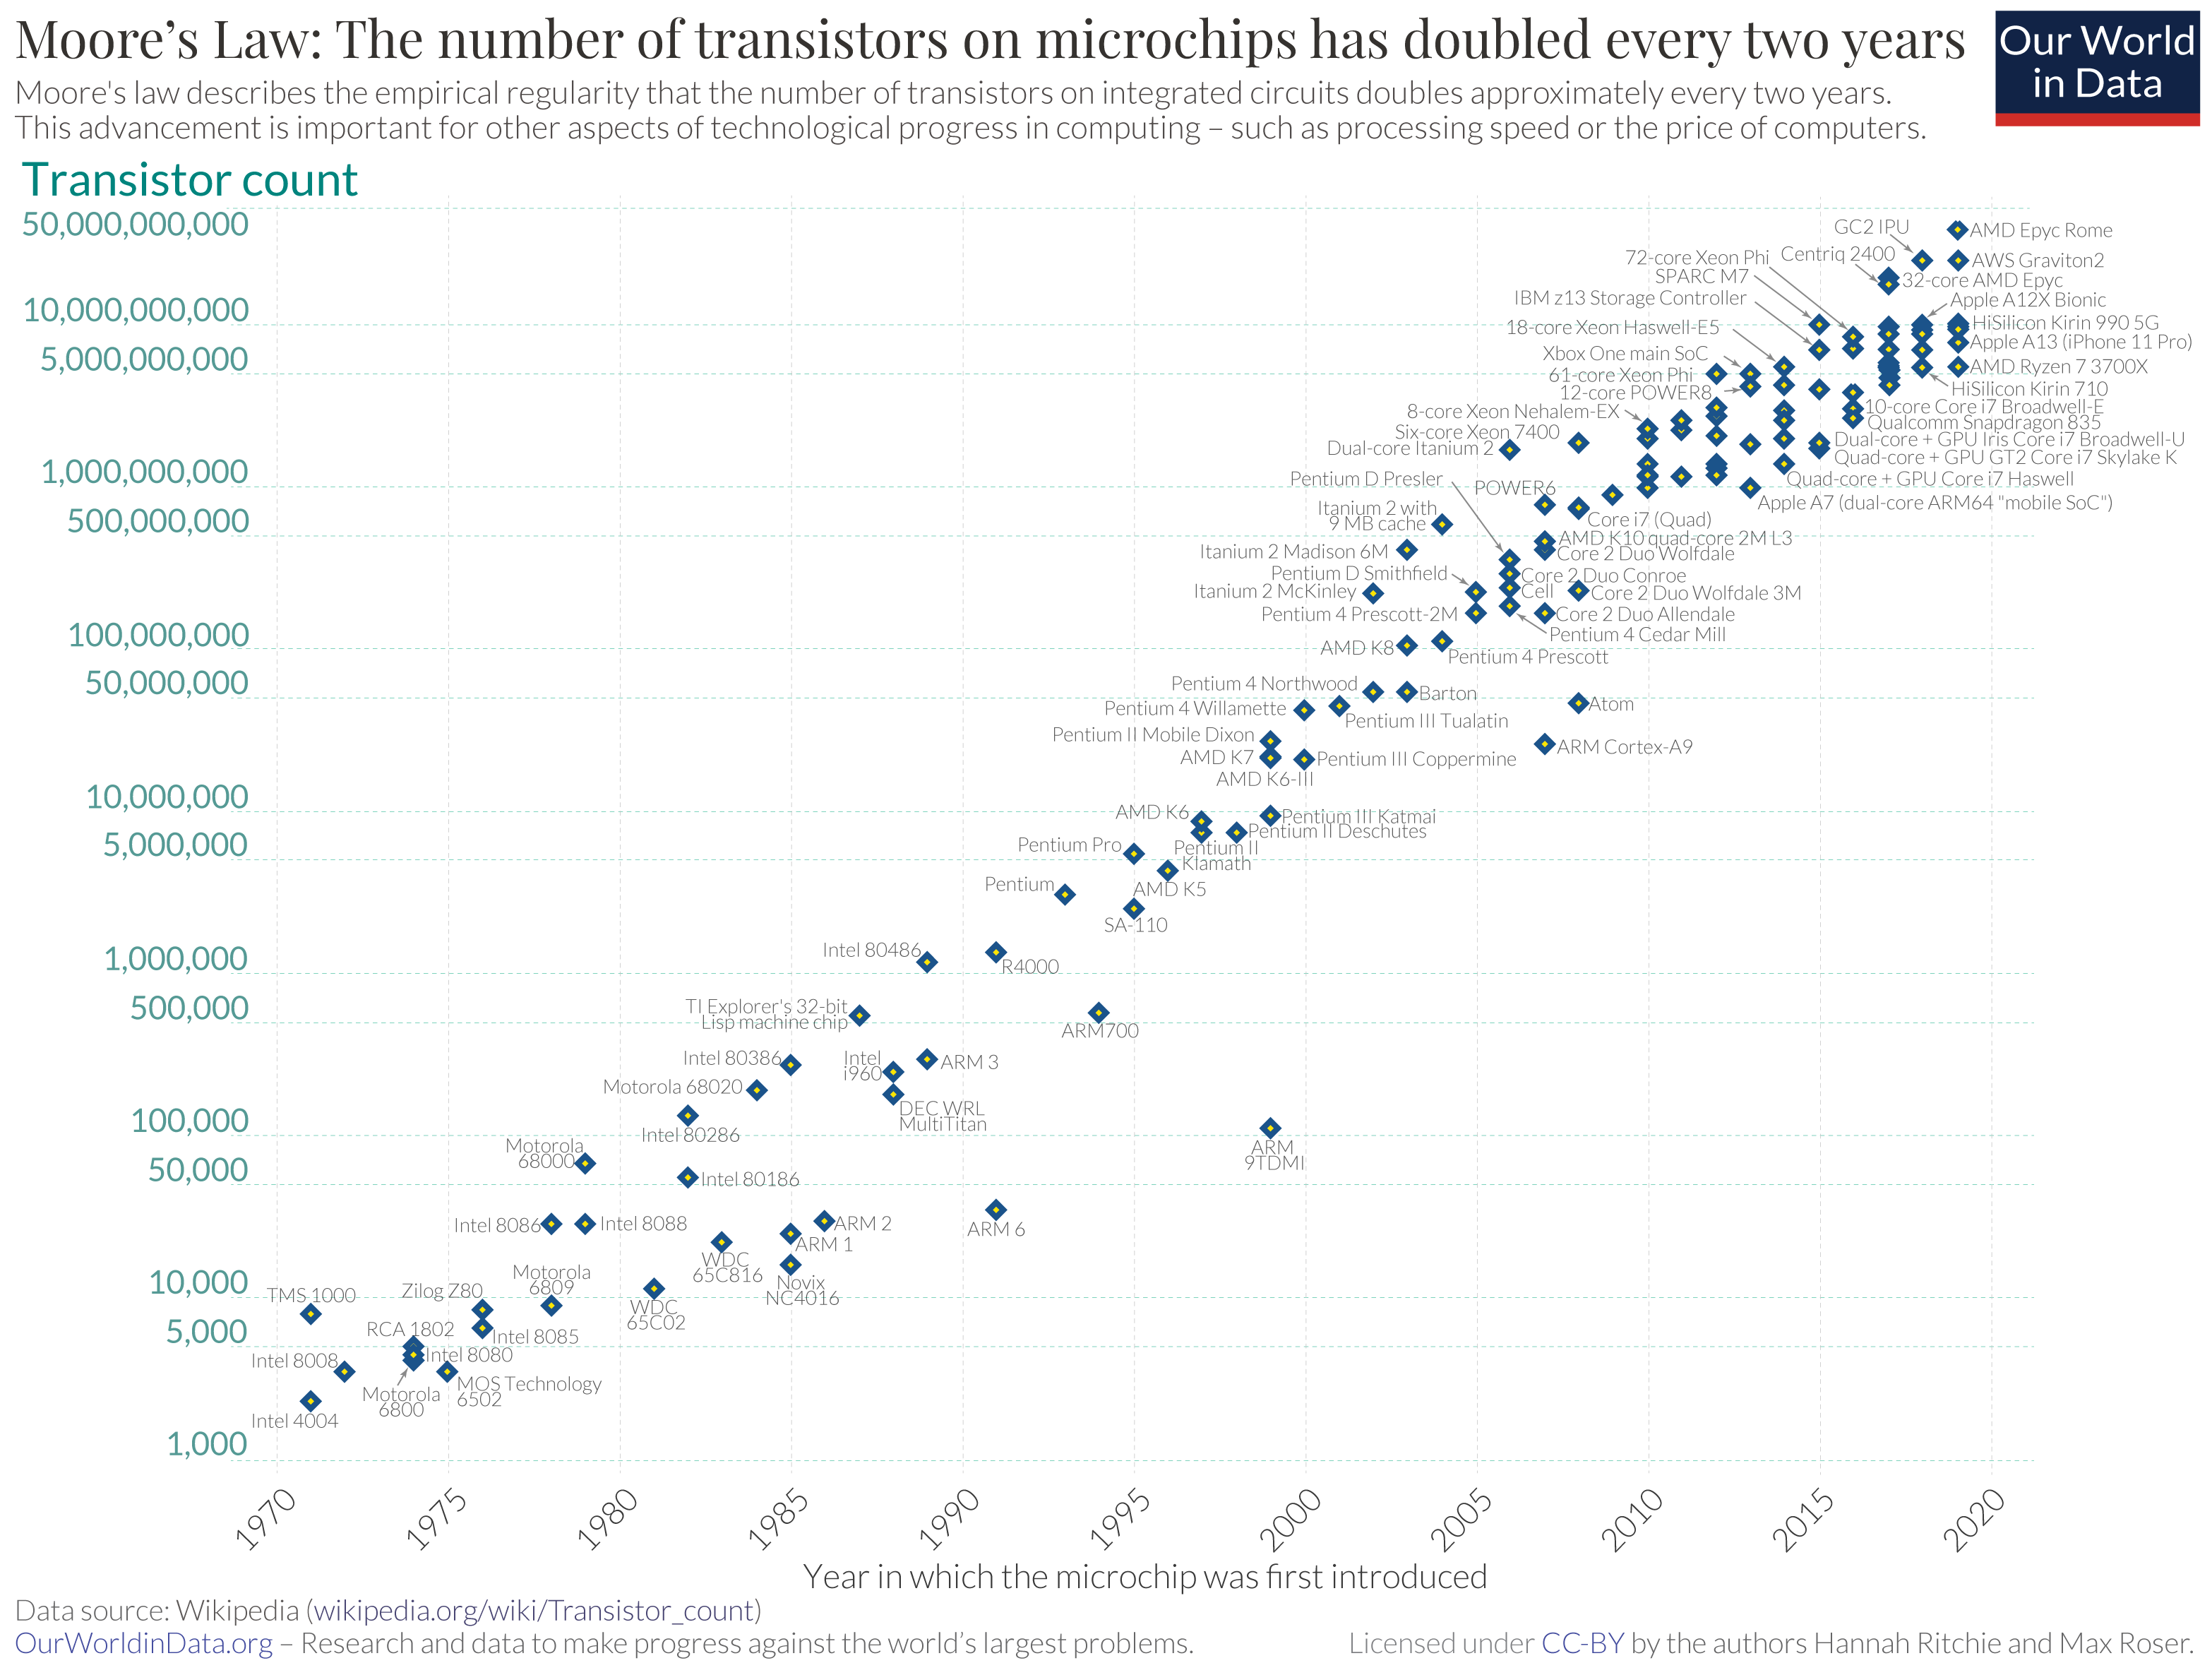
In the chart, we’ve visualized the growth in transistor density – the number of transistors on integrated circuits – from 1970 onwards.
It looks strikingly similar to Moore’s simple plot from 1965. Note again that the transistor count is on a logarithmic axis, so the linear relationship over time means that the growth rate has been constant.
This means that the growth of the transistor count has, in fact, been exponential. You can also see this on our interactive chart, which shows the average transistor count over time and where you can switch between a linear and a log axis
Transistor counts have doubled approximately every two years, just as Moore predicted.
This has held true for more than 50 years now.
There are many examples of exponential technological change
Moore’s Law describes the increasing number of transistors on integrated circuits, which in itself doesn’t matter for us as users of computer equipment. But it matters for those aspects that we do care about, like the speed and cost of computing.
Many related metrics show a similar pattern of exponential growth. The computational capacity of computers has increased exponentially, doubling every 1.5 years, from 1975 to 2009.3
More recent data is shown in the interactive chart. It shows the increase in supercomputer power, measured as the largest supercomputer in any given year. The unit of measurement is FLOPS: the number of computations the machine can carry out per second.

Computing efficiency – measuring the energy use of computers – has halved every 1.5 years over the last 60 years.4
Exponential progress is also found in the cost of computer memory and storage. In the chart, we see the cost of computer storage across different mediums – disks, flash drives, and internal memory – since the 1950s. This is measured as the price per terabyte.

Moore’s observation that the transistor count on integrated circuits grows exponentially is at the heart of many of the most consequential changes of our time. In our work on artificial intelligence we explore how the exponential growth translates in computing technology translated into more and more powerful AI systems.