No energy source comes without any environmental impact. Whether it’s coal, gas, nuclear or renewables, every energy source takes up land; uses water; and needs some natural resources for fuel or manufacturing.
But there are vast differences in these impacts between sources. Fossil fuels emit much more greenhouse gases per unit of energy than nuclear or renewables. They kill many more people from air pollution too.
How do these energy sources stack up when it comes to land use?
People are concerned about the impacts of land use for energy production for several reasons. The first is the technical question of whether we even have enough land to produce all of our energy from particular sources at all. The second is an aesthetic concern about how much of our landscapes might be taken up by these technologies. The third is the impact of land use on natural habitats and the environment.
Which sources of energy require the least amount of land?
One part of the total land use is the space that a power plant takes up: the area of a coal power plant, or the land covered by solar panels.
More land is needed to mine the coal, and dig the metals and minerals used in solar panels out of the ground. To capture the whole picture we compare these footprints based on life-cycle assessments. These cover the land use of the plant itself while in operation; the land used to mine the materials for its construction; mining for energy fuels, either used directly (i.e. the coal, oil, gas, or uranium used in supply chains) or indirectly (the energy inputs used to produce the materials); connections to the electricity grid; and land use to manage any waste that is produced.
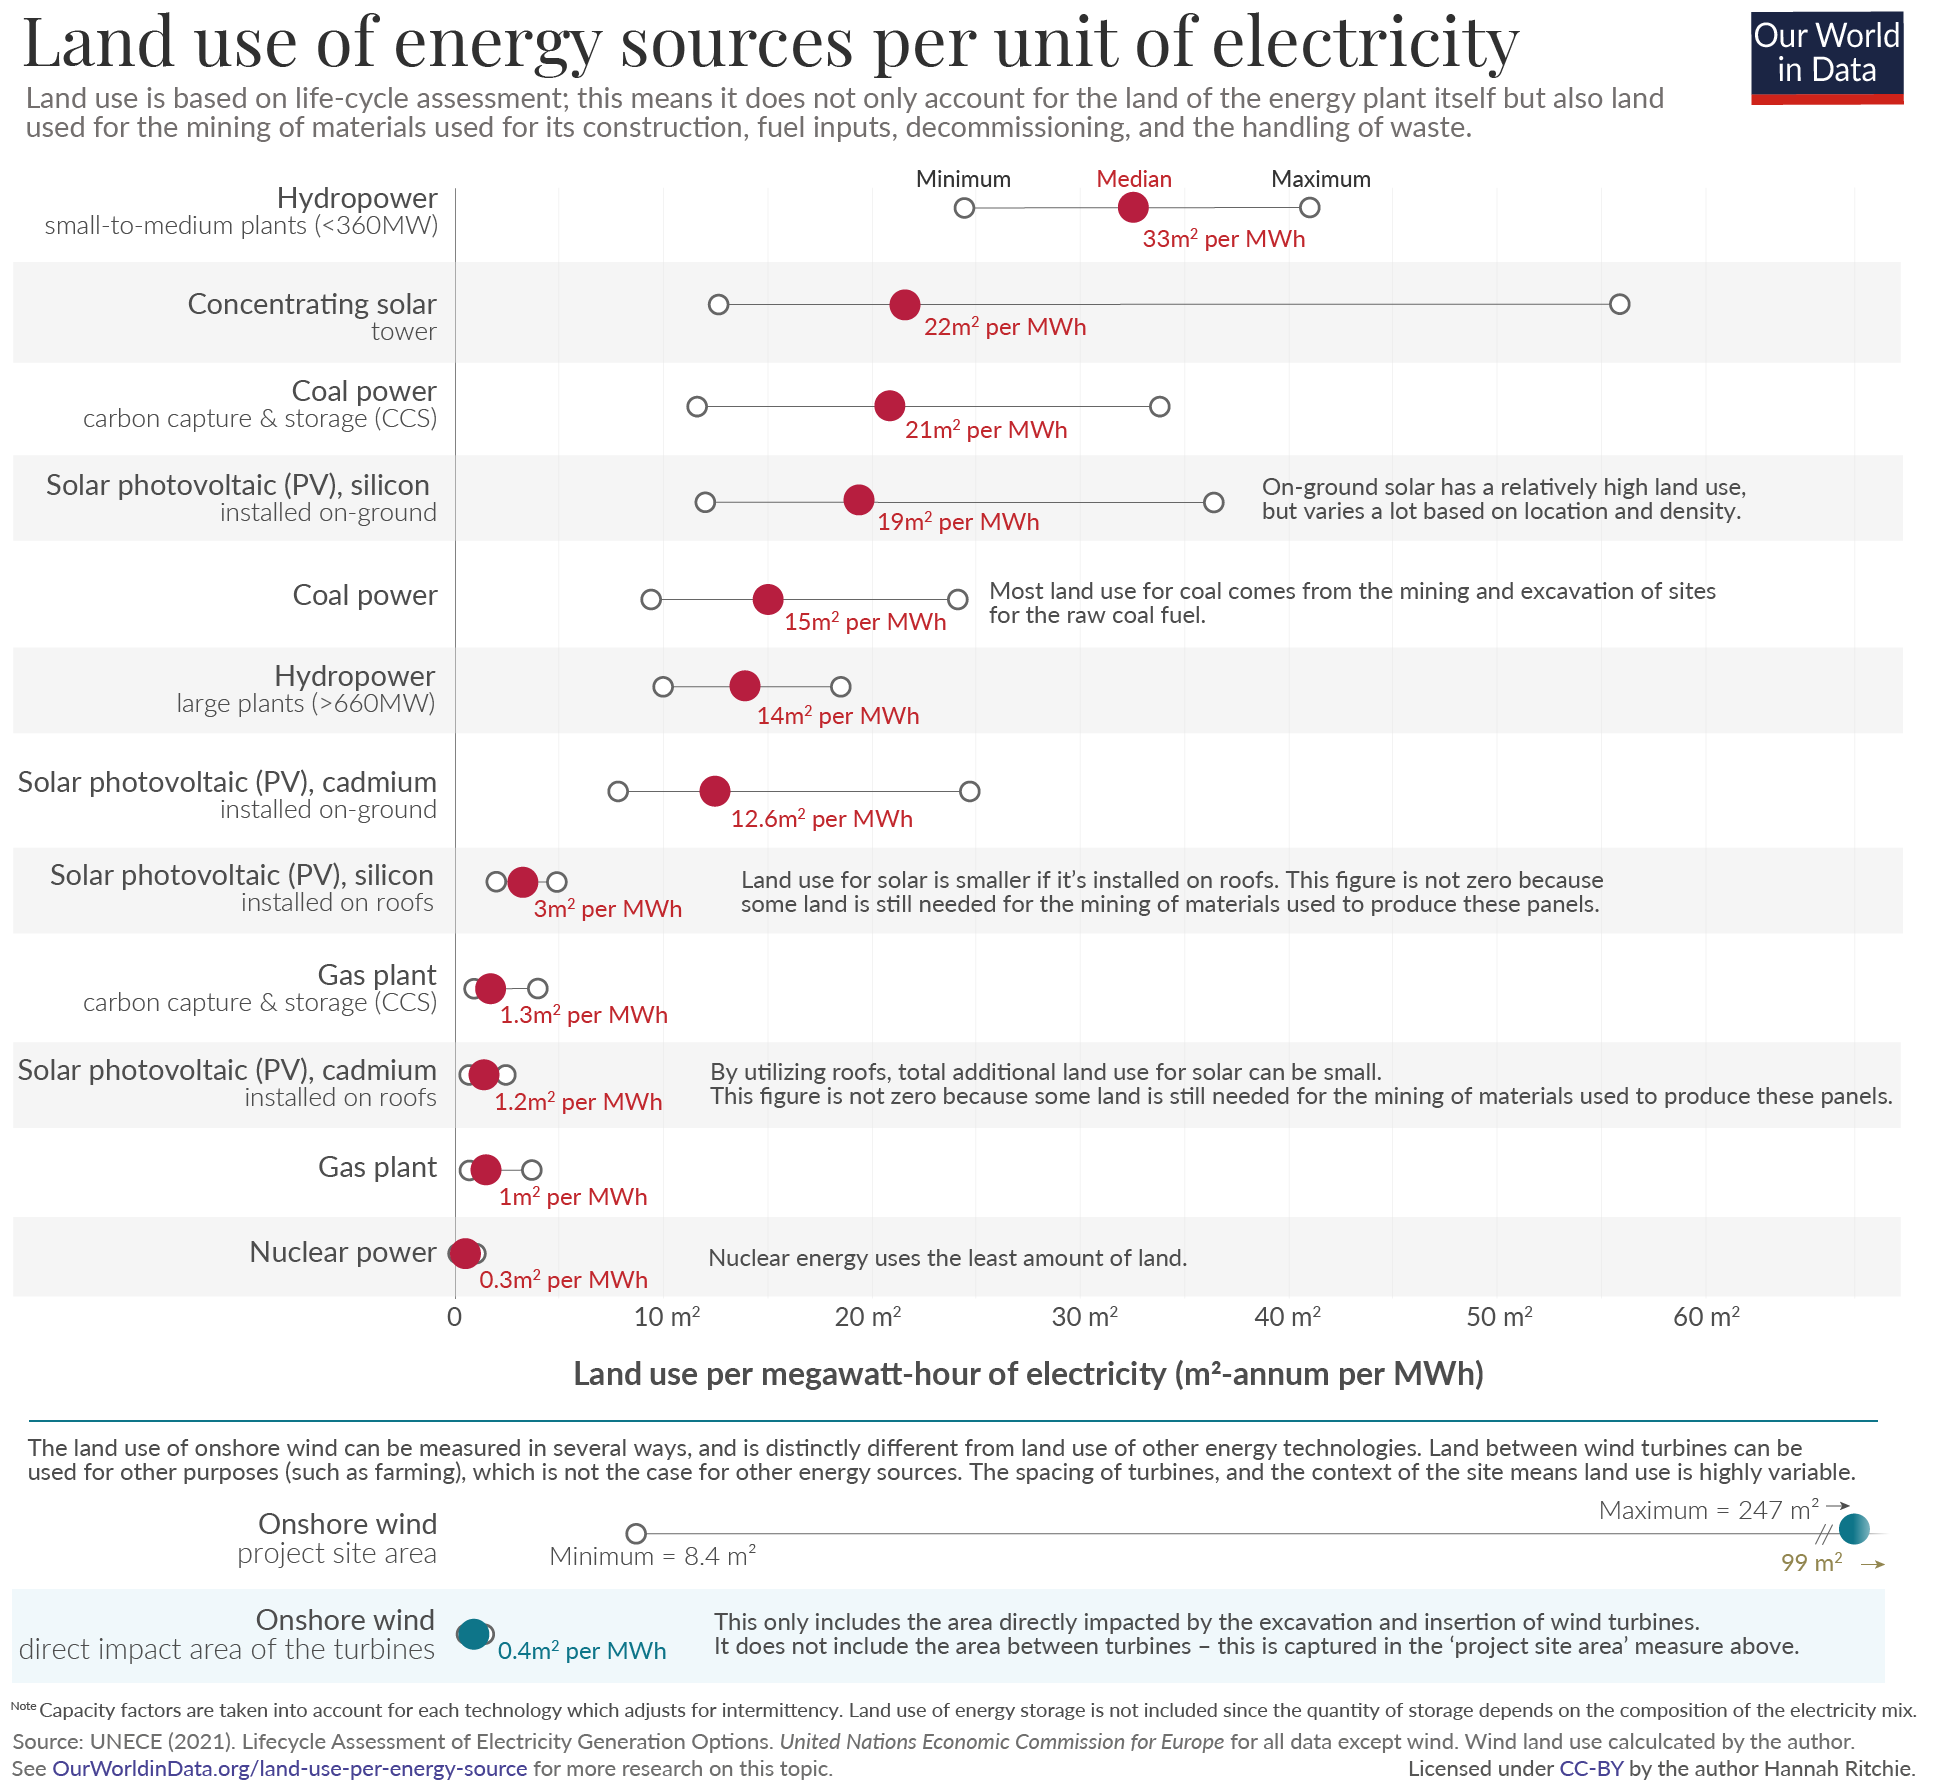
In the chart we see how the different energy sources compare.1 Here we’re only looking at key sources of electricity – since oil is predominantly used to transport, it’s not included. Their land use is given in square meters-annum per megawatt-hour of electricity produced. This takes account of the different capacity factors of these sources i.e. it is based on the actual output from intermittent technologies like solar or wind.
First, we see that there are massive differences between sources. At the bottom of the chart we find nuclear energy. It is the most land-efficient source: per unit of electricity it needs 50-times less land compared to coal; and 18 to 27-times less than on-ground solar PV.2
Second, we see that there are large differences within a single energy technology. This is shown by the wide range from the minimum to the maximum land footprint. This shows that land use depends a lot on how the technology is deployed, and the local context.
Solar energy is one example where the context and type of material matter a lot. Solar panels made from cadmium use less energy and materials than silicon panels, and therefore use less land per unit. It also matters a lot whether you mount these panels on rooftops or on the ground. Rooftop solar obviously needs much less additional land; we’re just using space that is already occupied, on top of existing buildings. However, they do need some land over their life-cycle because they still require mining of the materials to make them, as well as the energy (mostly electricity) used in refining the silicon. Finally, the density and spacing of the panels also makes a difference.
Wind is the most obvious electricity source that we should consider differently when it comes to land use. You find it separated from the other sources, at the bottom of the chart.3 There are several reasons for this. First, offshore wind takes up space, but it’s marine, not land area. Second, onshore wind is different from other electricity sources because you can use the land between turbines for other activities, such as farming. This is not the case for a coal, gas or nuclear plant. This means the land use of wind farms is highly variable. I have calculated the land use of 23 of the world’s largest wind farms [you find my calculations here].
Take the Roscoe Wind Farm in Texas, which uses 184 m2 per MWh. This is a large project, where farmers can generate additional income through electricity production while they continue their farming operations between the wind turbines. The wind farm is almost a secondary land use. This contrasts with much more dense wind farms, such as Fântânele-Cogealac in Romania, or the Tehachapi Pass in California, where energy production is the primary land use. These can have a small land footprint of just 8 m2 per MWh.
Our choices around where and how we deploy wind energy mean that it could use a lot of land, or possibly, less land than we use today.
Some suggest that we could apply the same principle to solar energy. In the UNECE assessment – the numbers we show on the chart – the surface area of solar panels is counted in its direct land use. But, not all analyses count this in the same way. Some suggest that, because the land underneath solar panels can sometimes be used for other purposes (such as farming), it should be counted as ‘co-used land’.4
There is evidence that these agrivoltaic systems, where PV panels are installed on agricultural land, could be great examples of shared land. Recent studies show that, under certain conditions, the yield of agrivoltaic crops can even increase compared with conventional crops, because of better water balance and evapotranspiration, as well as reduced temperatures.5
That highlights an important point: the costs of land use can vary a lot depending on where energy sources are built, and what the alternative uses of that land are. An energy source expanding into natural habitats or forests is not the same as building a solar farm in an unproductive desert.
Assessing our low-carbon energy transition as a whole: it might not take as much land as we assume. A transition built solely on nuclear power would need much less land than we use today. One built solely on renewables might require more land, but perhaps not much more.
Given the fact that transitioning to low-carbon energy technologies would prevent millions of premature deaths each year from air pollution, and tackle climate change, a small increase in land use – especially on unproductive lands – seems like a reasonable price to pay.
Land use of energy sources per unit of electricity6
Keep reading at Our World in Data


Updates and Revisions
This article was first published on 16th June 2022. It was updated on 8th July 2022 with the latest updated figures from the UNECE’s Lifecycle Assessment of Electricity Generation Options. You can find details of this correction and update here.
Acknowledgments
I would like to thank Thomas Gibon for the provision of underlying data from the UNECE Life-cycle assessment report, and for his feedback on this work. I would also like to thank my colleagues, Max Roser, Edouard Mathieu, Daniel Bachler, Pablo Rosado, Ike Saunders, and Bastian Herre for their suggestions on this article.