Seasonal flu is a contagious illness caused by the influenza virus. It kills around 400,000 people from respiratory disease on average each year. In large pandemics, when new strains have evolved, the death toll has been much higher. 

Yet, data on the flu is limited. With better testing, countries could improve their response to flu epidemics. It could help to rapidly identify new strains, detect epidemics early, and design better-matched vaccines to target flu strains circulating in the population.

This page therefore shows estimates of deaths during seasonal flu epidemics, historical flu pandemics, patterns of flu seasons in different countries, and confirmed cases of flu and flu-like symptoms across the world.

It also includes our Flu Explorer, a resource for epidemiologists, infectious disease researchers, and public health experts to monitor the global spread of the influenza virus.

Key insights on Influenza

Seasonal flu kills hundreds of thousands of people worldwide each year

The flu is estimated to cause 400,000 respiratory deaths each year on average across the world. These deaths come from pneumonia and other respiratory symptoms caused by the flu.1 

People also die from other complications of the flu – such as a stroke or heart attack – but global estimates have not been made of their death toll.2

The flu is most severe in infants and the elderly.3

Among those over 65, the flu kills around 31 people per 100,000 each year from respiratory disease in Europe. You can see this on the map.

But it’s not only age that matters, as the map shows. Death rates from the flu are higher in countries in South America, Africa, and South Asia, than in Europe and North America, due to poverty, poorer underlying health, lower access to healthcare, and lower vaccination rates.

In this article, we provide more detail:

What you should know about this data
  • The annual mortality rate of influenza was estimated by the Global Pandemic Mortality Project II using data between 2002 and 2011.4 They made these estimates using data from routine surveillance metrics for the flu, along with the number of excess deaths that occurred during flu seasons and mortality records where deceased people had respiratory symptoms.

  • These are estimates of flu deaths due to respiratory symptoms. People also die from other complications of the flu – such as a stroke or heart attack – which are not included here.

  • Estimates in low-income countries tend to be less certain due to lower levels of testing for influenza and limited mortality records.

Social distancing during COVID-19 had a large impact on the flu

In many countries, flu became much rarer during the COVID-19 pandemic, due to the impact of social distancing. 

You can see this in the chart. It shows the share of flu tests that were positive. In 2020 and 2021, there was a large decline in flu and the rates of positive tests were low.

Because the influenza virus is spread between people, through respiratory droplets and human contact5, social distancing led to a large reduction in contact between people and limited the virus from spreading.6

This decline was very large because of the mathematics of epidemics. 

The reproductive number (also called the R number) can help to understand why. This refers to the average number of people who will be infected by someone with the virus. When the R number is greater than 1, the average person who is infected will spread the virus to more than one person, who spread it to more and more people; the number of cases rises exponentially and leads to an epidemic.7

However, when the R number is lower than 1, the virus does not lead to an epidemic, and the number of cases falls exponentially.

Seasonal flu viruses tend to have an R number that is slightly above 1 at the start of an epidemic.8 Social distancing cut the number of contacts between people, and led to the R number of flu to dip much below 1 for a long time. This is why the spread of flu dwindled worldwide and was only seen in limited circumstances.9

What you should know about this data
  • Testing to confirm flu is limited in many countries.10 We therefore show the share of tests that were positive for the influenza virus.

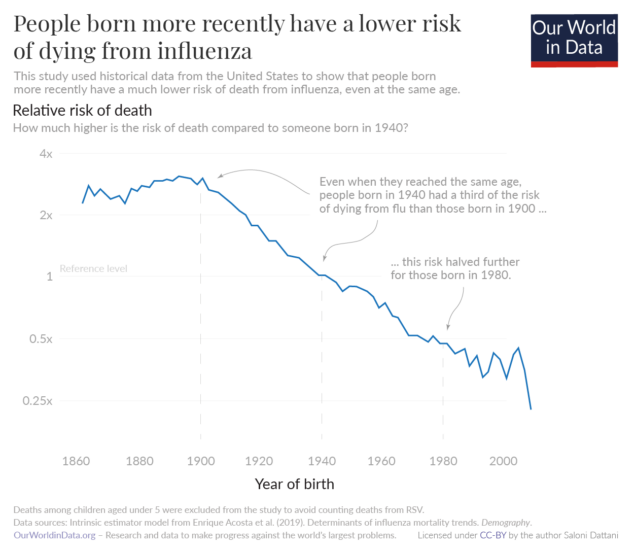
Seasonal flu used to be far more deadly

Over time, the severity of the flu has declined among people of the same age, as the chart shows.11

This is because of flu vaccination, which began in the 1930s and 1940s, as well as improvements in sanitation, neonatal healthcare, and childhood vaccination for other diseases.12 These benefits carried forward as people aged: they protected people from being vulnerable to diseases including influenza.

But the flu still causes a large burden today, especially in countries that have poor sanitation, healthcare, and low vaccination rates. 

Another challenge is that populations have been aging rapidly.13 In lower-income countries, the flu could become a larger burden as their populations continue to age.

In this article, we provide more detail:

What you should know about this data
  • These estimates come from a study by Enrique Acosta and colleagues, using data from the United States.14

  • The authors use national data on deaths and routine surveillance data for flu to calculate the rate of excess deaths during flu seasons, while accounting for changes in the age structure of the population.

  • The chart shows that the risk that someone dies from influenza at a given age has declined over time. But, because the population is getting larger and older, the total number of flu deaths has remained stable.
People born more recently have a lower risk of dying from influenza. Even when they reached the same age, people born in 1940 had a third of the risk of dying from flu than those born in 1900. This risk halved further for those born in 1980.

Flu seasons vary between countries

Several respiratory infections, including the flu, are more common in the winter. 

This is because they transmit more efficiently at lower temperatures and humidity, and when there is more social contact between people indoors.15

In the chart, you can see the share of flu tests that were positive in different countries.

Although the precise start and end of a flu season vary between years, flu epidemics tend to occur between November and May in the Northern Hemisphere. Meanwhile, in the Southern Hemisphere, they generally occur between June and October. 

But in countries closer to the equator, there tend to be multiple peaks each year, or flu is present throughout the year. This may be because of rainy seasons, when people have more indoor contact.16

You can see this in the chart for Singapore and Thailand, for example.

What you should know about this data
  • Testing to confirm the flu is limited in many countries.17

Tracking flu-like symptoms can be informative when testing is limited

Direct testing for the presence of the influenza virus is limited in many countries. For this reason, flu cases recorded in public databases – and the global data shown in our data explorer – greatly underestimate the true number of cases.

Because of the lack of direct testing, it is useful to track flu-like symptoms.

It is important to note however that these symptoms are not specific to the flu: people with other diseases – such as rhinovirus, COVID-19, common colds, malaria, and others – can also have these symptoms and meet the following criteria.

Acute respiratory infections (ARIs) are the broadest type of metric. They can include anyone with sudden onset of at least one of the following symptoms: cough, sore throat, shortness of breath or rhinitis (inflammation of the mucous lining of the nose), but only if they were judged by a doctor to be caused by an infection.

Influenza-like illnesses (ILIs) are narrower – they include only people with a sudden respiratory infection with a fever above 38ºC and a cough within the last 10 days.18

Severe acute respiratory infections (SARIs) are severe cases of ILIs: they include only people with a sudden respiratory infection who had a fever above 38ºC, a cough, and required hospitalization.

In many countries, only a fraction of clinics in the country report flu-like metrics to their national system. This means that the number of reported cases does not tell us about the total number of people with these infections.

Since some countries provide data from a larger number of healthcare clinics than others, this needs to be kept in mind when comparing different countries.19

What you should know about this data
  • Countries may use different sources for each metric. Some countries collect data for ARIs universally, i.e. from all hospitals and outpatient clinics in the country, while many do not.20

  • The country’s sampling method may also be different for ILIs or SARIs. The sampling strategy for each metric and for each country is reported to the WHO.21

Different flu strains circulate each year

Each year, flu vaccines need to be updated because different viruses circulate in the population.

This happens for two reasons. One is that flu viruses gradually evolve, and can evade people’s immunity and cause reinfections.22

Another reason is that there are different types of flu that circulate each season. 

You can see this in the chart. It shows cases of two types of influenza: A and B, which commonly infect humans.23

There are many subtypes of influenza A, including H1N1 and H3N2 among others.24 In contrast, there are two lineages of influenza B, which are called Victoria and Yamagata.25

Unfortunately, testing for the flu is limited, and many countries lack testing to identify specific flu strains. This is why the number of confirmed cases shown in the chart greatly underestimates the actual number of infections, and why some cases are shown as ‘unknown subtype/lineage’.26

This lack of testing is a problem. When there is a mismatch between the strains in the vaccine and the viruses circulating in the population, vaccines tend to have lower efficacy and the flu season tends to be more severe.27 Additionally, limited testing also means the world is less able to detect new strains that may cause pandemics.28

To address this, the world needs more routine testing for the flu.

What you should know about this data
  • This metric shows confirmed cases of flu: when people with flu symptoms have respiratory samples taken and tested to determine whether they have the influenza virus and whether they have influenza A or B. Some surveillance centers also test the samples to identify their subtype. These are described as strains for influenza A (e.g., A H7N9) and lineages for influenza B (e.g., B Yamagata). This testing can use molecular detection, virus culture, or immunological methods.29

  • Testing to confirm flu is limited in many countries.30 In addition, not all confirmed flu cases are tested further to identify their strain. This is why many cases are shown as having an unknown subtype or lineage.31

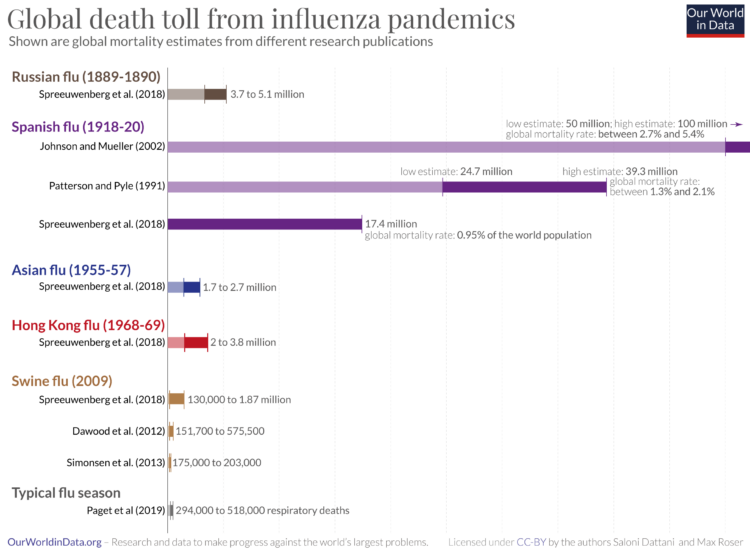
The Spanish flu caused the largest influenza pandemic in history

Some flu seasons are far more severe than usual seasonal influenza.

This happens when influenza viruses combine with each other to make new strains which are more infectious and lethal, and lead to deadly pandemics.32

For example, the Spanish flu pandemic was caused by a combination of human influenza and another animal influenza. Together, they formed the new H1N1 virus.33

As you can see in the chart, it led to the most devastating influenza pandemic in recorded history. Estimates of the death toll vary: some studies estimate that 17.4 million people died globally from the Spanish flu between 1918 and 1920, while others estimate a much higher death toll of 50 to 100 million deaths.34

The Spanish flu pandemic was most severe among children and young adults. Life expectancy at birth and at young ages declined by more than ten years.

But surprisingly, it did not have a significant impact on older people. Research suggests that this is because older generations had been exposed to similar H1 influenza viruses decades before the pandemic began, which gave them some protection against the Spanish flu strain.35

In this article, we provide more detail:

What you should know about this data
  • In the chart, we show a comparison of mortality estimates from different research groups for recent flu pandemics in history.36

  • Estimates for historical flu pandemics tend to come from data on mortality rates. Pandemics cause sudden shocks to mortality compared to typical years. Researchers can calculate the excess mortality during the pandemic to estimate the deaths they caused while adjusting for other known factors, such as famine and war. 

  • There are still large uncertainties in each estimate, because historical mortality records are limited in many countries. However, the range of estimates for these pandemics is much higher than a typical flu season. For the Spanish flu pandemic, estimates are more than an order of magnitude higher.
Influenza pandemics in comparison 1

Explore our data on influenza

Why we provide this Influenza Data Explorer

With this Flu Explorer, we aim to provide a helpful resource for epidemiologists, infectious disease researchers, and public health experts to understand the global spread of the influenza virus.

It differs from our widely-used infectious diseases projects, such as the COVID-19 Explorer and the Mpox Explorer. These tools are designed for a broad audience. Unfortunately, flu data is incomplete in many ways, making it harder to communicate. This tool is therefore designed for users with pre-existing knowledge to navigate effectively the complex data published by the World Health Organization.

The explorer also highlights the significant gaps in influenza data. It is an important reminder of the need to improve data collection and reporting.

Interactive charts on Influenza